We Tested 4 “Oversold” Signals. Only One Has an Edge.
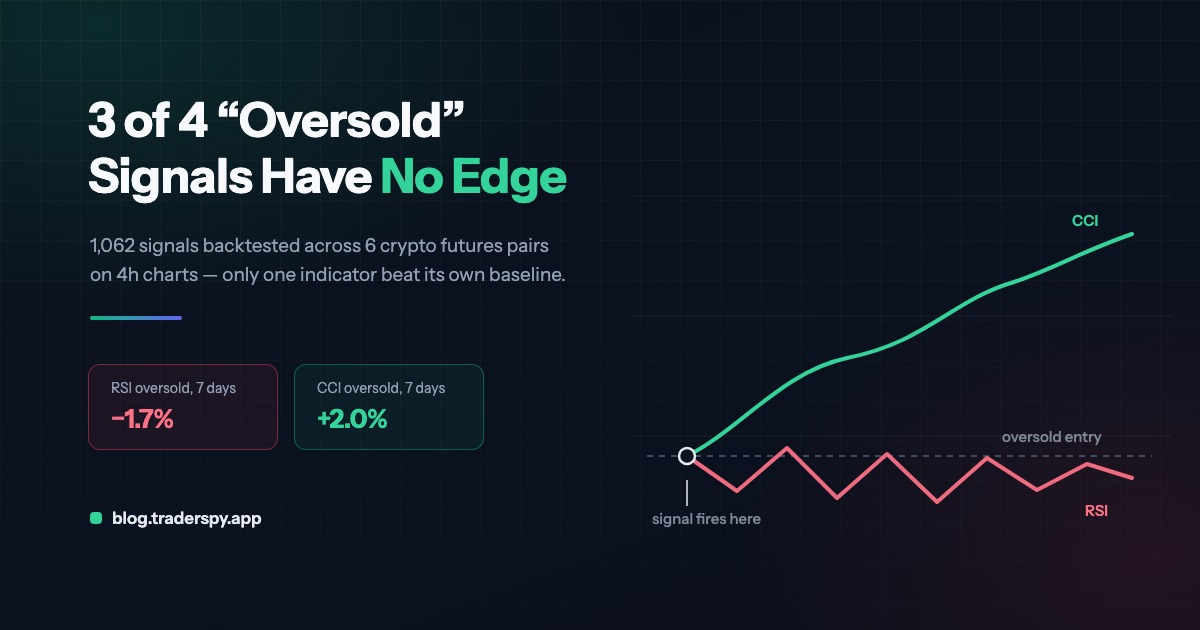
We backtested 1,062 oversold signals across 6 crypto futures pairs. RSI, Stochastic and MFI showed no edge after a week. CCI returned +2%.
Bitcoin is sitting around $77,600, RSI neutral in the mid-50s on both the 4-hour and daily chart. Nothing is oversold on the majors right now. But somewhere on some pair, every few days, RSI drops under 30, or CCI drops under -100, or Stochastic falls under 20 — and traders reflexively buy the dip because “it’s oversold.”
We stopped assuming and measured it. Every oversold trigger from four different indicators, on six major perpetuals, over the last 1,000 four-hour candles. 1,062 signals total. Three of the four showed no real edge over doing nothing. One did, and it is probably not the one you reach for first.
What We Tested
Using TraderSpy’s own event-study engine — the same backtest_condition tool exposed on our MCP server — we pulled 4-hour candles for BTC, ETH, SOL, XRP, BNB and DOGE perpetuals and flagged every bar where each of these went “oversold”:
- RSI(14) < 30
- Stochastic %K(14,3) < 20
- Williams %R(14) < -80
- MFI(14) < 20
- CCI(20) < -100
Every flagged bar was raced forward 1 day, 3 days and 7 days, and the return was compared against that symbol’s own unconditional baseline return over the same bars. “Win rate” here means exactly one thing: price closed higher N days later than it did the moment the signal fired. No stop, no target, no management — the simplest possible test of whether a signal carries any directional information at all. “Edge” is the conditional return minus the baseline, which is what isolates the signal from the tape’s own drift.
We pooled results across all six pairs, weighted by how many times each signal actually fired. The 7-day column below has slightly fewer signals than the 1-day and 3-day columns for the same reason a stopwatch does — the most recent triggers haven’t been running long enough yet to show a 7-day result.
The 7-Day Scoreboard
| Indicator | Signals | Win Rate | Avg Return (7d) | Edge vs Baseline |
|---|---|---|---|---|
| RSI < 30 | 51 | 43.1% | -1.7% | -2.5% |
| Stochastic < 20 / Williams %R < -80 | 345 | 51.6% | +0.3% | -0.5% |
| MFI < 20 | 75 | 49.3% | -1.1% | -1.9% |
| CCI < -100 | 253 | 60.9% | +2.0% | +1.3% |
Read that middle column again. RSI oversold — the signal every trader learns first — had a worse-than-coinflip win rate a week out, and lost 1.7% on average. CCI oversold, the least glamorous name on the list, won 61% of the time and returned +2%.
The Edge Doesn’t Hold — Except Once
The scoreboard above is the 7-day snapshot. What makes CCI interesting is what happens as you zoom out from 1 day to 7:
| Indicator | Edge at 1 Day | Edge at 3 Days | Edge at 7 Days |
|---|---|---|---|
| RSI < 30 | -0.1% | -0.6% | -2.5% |
| Stochastic / Williams %R | -0.4% | -0.3% | -0.5% |
| MFI < 20 | +0.0% | -0.4% | -1.9% |
| CCI < -100 | -0.1% | +0.4% | +1.3% |
Three indicators start near zero edge and decay into a loss. CCI starts near zero and compounds into a gain. That is the opposite of noise — noise doesn’t grow more reliable with time. And it isn’t one lucky pair carrying the average: at the 7-day mark, CCI’s edge was positive on five of the six pairs tested (BTC, SOL, XRP, BNB, DOGE), and only ETH broke the pattern.
None of this means CCI is a trading system. A 1.3% edge over a baseline, on a signal that fires roughly twice a week per pair, is real but modest — it is an argument for using CCI as one input among several, not for going all-in the next time it prints -110.
Why CCI and Not RSI
Here’s the part that should make you suspicious of “rare = strong.” RSI < 30 fired only 55 times across six pairs and five and a half months — genuinely rare. CCI < -100 fired 267 times, roughly five times as often. The rarer signal performed worse.
The likely reason is mechanical. RSI measures the ratio of up-moves to down-moves — by the time it grinds under 30, a coin has usually been bleeding for several consecutive candles, and that bleeding has real odds of continuing into the move that finally exhausts it. CCI measures deviation from a moving average in absolute price terms, with no upper or lower bound, so it can spike to -100 on a single sharp drop rather than requiring a sustained losing streak. It is catching a different kind of event — a shock rather than a grind — and shocks mean-revert more reliably than grinds do. That is a hypothesis based on this data, not a law of markets, which is exactly why we tested it instead of assuming it.
The Asymmetry: Oversold Isn’t the Mirror of Overbought
We also ran CCI > 100 — the “overbought” read — expecting the mirror image of the oversold result. It wasn’t.
| CCI > 100 | Signals | Win Rate | Avg Return (7d) | Edge vs Baseline |
|---|---|---|---|---|
| 7 days | 282 | 46.1% | +0.9% | +0.1% |
Win rate below 50%, yet average return still slightly positive. That combination only happens when a few large winners are dragging the average above a majority of small losers — and the data confirms it: the median 7-day return on a CCI > 100 signal was negative on four of six pairs, while the mean was positive on all six. XRP’s best occurrence in the sample returned +40% over the following week; most of the rest lost a little.
The lesson: CCI < -100 behaves like mean reversion (high win rate, small consistent edge). CCI > 100 behaves like momentum (low win rate, occasional outsized runner). Fading strength the same way you buy weakness is fading the fat tail that makes momentum trading work at all.
Two Indicators, One Signal
One more thing worth knowing before you stack indicators for “confirmation”: Stochastic < 20 and Williams %R < -80 fired on exactly the same bars, every single time, across all six pairs. That isn’t a coincidence — with the same look-back period, Williams %R is just the raw Stochastic %K minus 100. Ask your screener for one and you have already asked for the other.
If your checklist says “enter when RSI, Stochastic and Williams %R all agree,” you are really running a two-indicator checklist wearing a three-indicator costume. It’s the same lesson our breakout study landed on with ADX: every filter you add has to independently pay for itself, or it’s just noise with extra steps.
The Practical Playbook
- Stop treating “RSI < 30” as a buy signal by itself. In this sample it had a losing edge by day 7. It may still be useful as one input in a larger setup — our RSI/MACD combo pairs it with trend confirmation rather than firing alone.
- If you trade oversold conditions, CCI < -100 is the better-tested trigger — not a guarantee, but the only one of the four that showed a durable, growing edge in this data.
- Don’t double-count Stochastic and Williams %R as independent confirmation. Pick one.
- Don’t mirror the oversold logic onto overbought. Fading a CCI spike above +100 fights a fat right tail, not a fat left one.
- Size and stops still do the heavy lifting. A 1.3% edge on a 61%-win signal is real, but it’s not big enough to skip volatility-scaled stops — a couple of bad entries at fixed size erase what the edge built over dozens of trades.
How TraderSpy Handles This
This is exactly why TraderSpy’s AI alert engine was never built around a single oversold reading. Every preset combines structural levels, ATR, volume profile and multi-indicator confluence before it publishes, and the validator scores what BTC’s own regime is doing before trusting a setup — a lesson we learned the hard way tuning the signal engine over several rounds this year.
You don’t have to take the numbers in this article on faith, either. screen_symbols and backtest_condition are two of the tools on TraderSpy’s MCP connector — connect it to Claude, ChatGPT or Claude Code and ask it to run the same test on your own pair, your own timeframe, or a threshold we didn’t try. It’s free to try and the whole study above took a fraction of the manual work it would have taken in a spreadsheet.
The Key Takeaway
“Oversold” is not one thing. Four indicators that all claim to measure it produced four different outcomes on the same six pairs — three of them a net loss by day 7, one of them a real, compounding edge. The instrument you learned first isn’t automatically the one that works, and the only way to know which is which is to test it rather than assume it.
Track confirmed setups on TraderSpy instead of guessing which oversold reading to trust.