Why 58% of Crypto Breakouts Fail (And How to Filter Them)
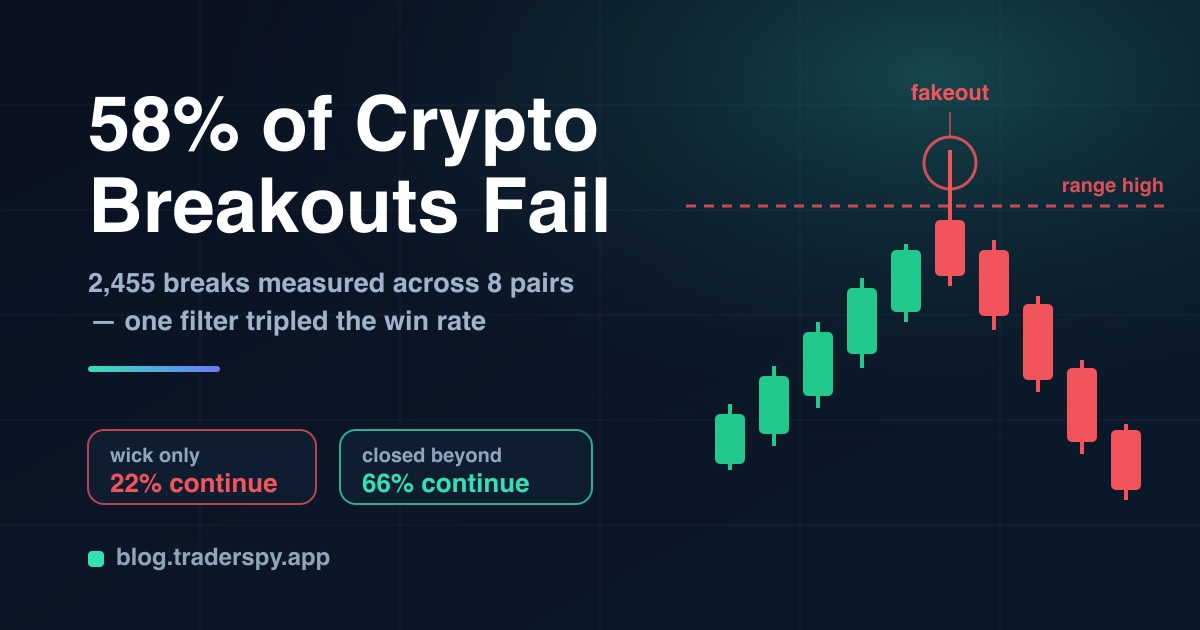
We measured 2,455 breakouts across 8 crypto pairs. 58% failed. One filter — waiting for the candle to close — tripled the continuation rate from 22% to 66%.
Bitcoin is trading near $65,000 and has spent the last month inside an 8% box. Average daily true range over the past two weeks is 1.94%, against a one-year average of 3.42%. Volatility has been squeezed out of this market — and compressed markets manufacture breakouts that go nowhere.
Every trader knows the feeling. Price clears the range high, you enter, and forty minutes later you are stopped out watching the candle close back inside. So we stopped guessing and measured it.
What We Measured
We pulled Binance USDT-perpetual data for 8 major pairs — BTC, ETH, SOL, XRP, BNB, DOGE, ADA and LINK — and flagged every moment price traded beyond its 20-candle high or low (a Donchian-20 break, both directions).
That produced 2,455 breakout events: 1,216 on the 1-hour chart (8 June – 10 August 2026) and 1,239 on the 4-hour chart (3 December 2025 – 10 August 2026).
Each break was then raced forward to one of two outcomes:
- Continuation — price extended 1.0× ATR(14) beyond the broken level.
- Failure — a candle closed back through the level by more than 0.25× ATR.
Whichever came first inside the next 12 candles (1h) or 6 candles (4h) settled the event. Only 28 of the 2,455 never resolved.
The headline number: of every breakout that resolved, 57.9% failed before it ever extended a full ATR. Buying breaks blindly is a losing business.
But the aggregate hides the useful part.
Filter 1: Wait for the Candle to Close
Split the same events by one question — did the candle that broke the level actually close beyond it, or did it only wick through?
| Break type | Events | Continued | Failed |
|---|---|---|---|
| Wick only (closed back inside) | 1,316 | 22.0% | 78.0% |
| Closed beyond the level | 1,111 | 65.8% | 34.2% |
That is the whole game in one table. A break that closes back inside the range continues barely one time in five. A break that closes outside continues two times in three. Same level, same chart, same instrument — the only difference is whether you waited for that candle to close.
This is not a quirk of the sample. It is the mechanical signature of a liquidity grab: resting stop orders and buy-stops sit just above obvious range highs, so pushing price through them is the cheapest way for size to get filled. The wick is the fill. The close is the truth.
We ship this rule in production. When we added a wait-for-close requirement to the trend-continuation signals inside TraderSpy, the 1-hour segment went from break-even to a profit factor near 1.9 — the single largest improvement in that tuning cycle. Most of what it eliminated were intra-candle fakeouts that never traded to the first target.
Filter 2: Demand Volume Expansion
Take only the breaks that closed beyond the level, then split by volume on the break candle against the 20-candle average.
| Confirmed break | Events | Continued |
|---|---|---|
| Volume ≥ 1.5× average | 773 | 73.1% |
| Volume < 1.5× average | 338 | 49.1% |
A quiet breakout is a coin flip. A breakout on 1.5× normal volume works nearly three times out of four. Volume is the crowd agreeing that the level mattered; without it you have one participant pushing price into thin liquidity, and thin liquidity retraces.
Stack the two filters and you go from a 42% base rate to 73% — while discarding roughly two-thirds of all signals. That trade is the point. Breakout trading is a filtering problem, not a spotting problem.
Filter 3: The One That Didn’t Work
Conventional advice says to confirm breakouts with ADX — only trade them when trend strength is rising. We tested it on the same confirmed breaks:
| Confirmed break | Events | Continued |
|---|---|---|
| ADX(14) ≥ 20 | 728 | 66.3% |
| ADX(14) < 20 | 383 | 64.8% |
A 1.5-point difference across 1,111 events is noise. Layered on top of the close-and-volume filter, ADX added nothing at all — the triple-filtered bucket continued 72.6%, marginally worse than close-plus-volume alone.
The lesson generalises beyond ADX: every filter you add costs you signals, so each one has to pay for itself. Two filters that work beat five that sound rigorous. Test the ones you have before adding another.
The Practical Playbook
- Mark the level before price gets there. A 20-period high or a clean horizontal from prior structure. Levels drawn after the break are hindsight.
- Do not enter on the touch. Wait for the candle close beyond the level. On a 4-hour chart that is patience; on a 1-hour chart it costs you minutes and saves you most of your losers.
- Check volume on the break candle. Below 1.5× the recent average, skip it or halve your size.
- Place the stop below the reclaimed level, not at it. Our invalidation used 0.25× ATR of buffer for a reason — the retest routinely dips a few ticks under. Size the stop off volatility, not off the round number (ATR-based stops).
- Target at least 1× ATR. That is the distance the study proved is reachable; anything less and fees plus slippage eat the edge.
- Trade the failure too. A break that closes back inside the range fails 78% of the time — the failed breakout is itself one of the higher-probability setups in a compressed market, taken in the opposite direction back toward the range low.
Why This Market Punishes Impatience
The current tape is the worst possible environment for unfiltered breakout trading. With daily ranges near 1.9% and Bitcoin pinned in a narrow box, there is not enough follow-through to bail out a bad entry. In a trending market a sloppy breakout entry gets rescued by momentum; in a range it gets stopped.
Compression does eventually resolve — volatility crushes precede expansion, and Bollinger Band squeezes mark where the pressure is building. The traders who profit from that expansion are the ones who did not bleed their account on the twenty fake breaks that came first.
How TraderSpy Handles This
Waiting for candle closes across dozens of pairs and multiple timeframes is not something you can do manually. TraderSpy’s signal engine evaluates compound conditions — price structure, volume expansion, RSI, MACD, ADX, ATR and more — on every tracked pair continuously, and only publishes a signal after the confirmation candle closes.
Each published signal ships with volatility-scaled stops and a laddered target structure, so the levels are set by the same logic the study validates rather than by round numbers. You can also see whether top traders are positioned with the break or fading it, which is often the tiebreaker on a marginal setup.
The Key Takeaway
Breakouts are not broken — unconfirmed breakouts are. The raw event has a 42% continuation rate, which is a losing hand after costs. One filter takes it to 66%. Two take it to 73%.
The cost of that improvement is patience measured in single candles, and the discipline to skip two-thirds of what looks tradeable. In a market compressed to 1.9% daily ranges, that discipline is the entire edge.
Start tracking confirmed setups on TraderSpy and let the engine wait for the close so you do not have to.