Whales Are Buying the Crash: What Smart Money Sees That You Don't
While retail traders panic-sell, Bitcoin whales accumulated $4 billion in a single week. Learn how to read on-chain whale signals and use smart money data to make better trading decisions.
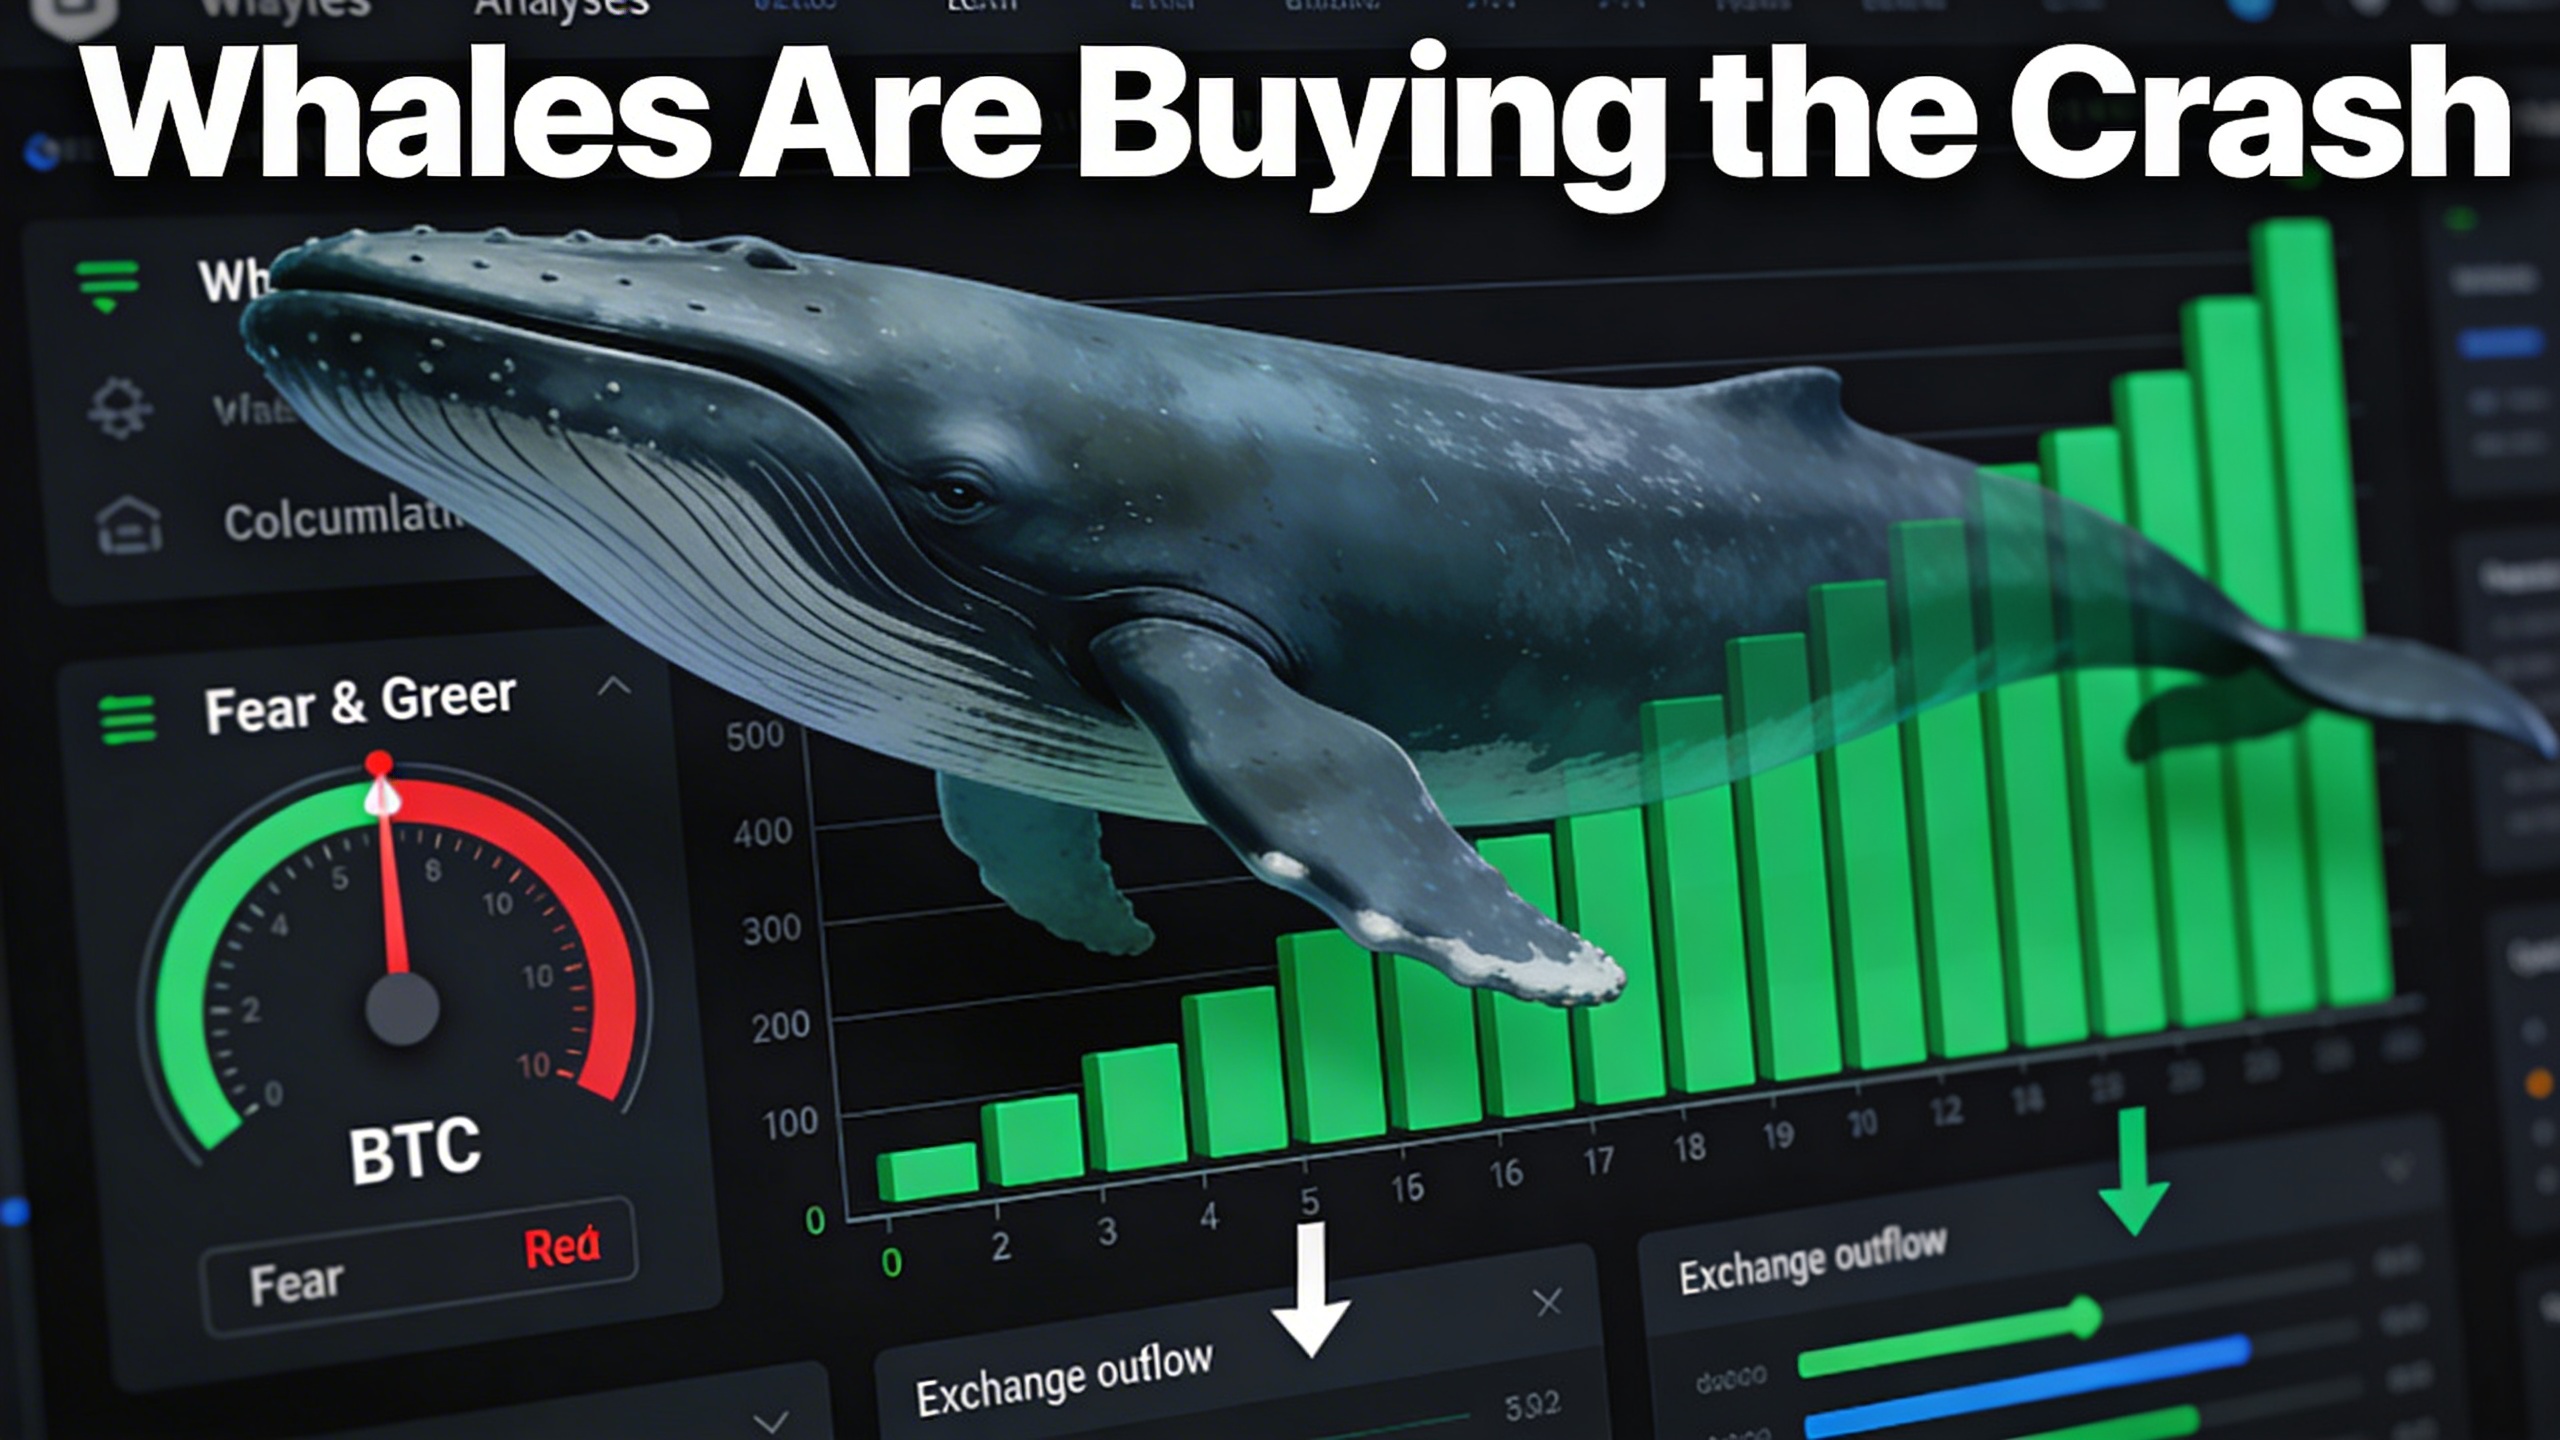
On February 6th, 2026, the Crypto Fear & Greed Index hit 5 — the lowest reading ever recorded. Lower than the Terra collapse. Lower than FTX. Lower than the 2022 bear market bottom. Retail traders were liquidated, panic-selling, and declaring crypto dead on social media.
At the same time, on the exact same day, whale wallets absorbed 66,940 BTC into accumulation addresses — the largest single-day whale purchase of 2026 and the biggest since 2022. In the following week, wallets holding more than 1,000 BTC added over $4 billion worth of Bitcoin.
This divergence — retail panic selling while smart money aggressively buys — is one of the most reliable signals in crypto markets. It has appeared at or near the bottom of every major cycle in Bitcoin’s history. And it is happening right now.
The question is not whether whales are buying. On-chain data confirms they are. The question is: how do you use this information to make better trading decisions?
The Retail vs. Smart Money Divergence
Markets are driven by two forces: fear and greed. But these emotions affect different market participants in opposite ways. When fear peaks, retail traders sell. When fear peaks, whales buy. This asymmetry is not random — it is structural.
Why Retail Sells at the Bottom
Retail traders are reactive. They buy when prices are rising and everyone is optimistic. They sell when prices crash and headlines scream disaster. This pattern repeats because:
- Loss aversion: The pain of losing $10,000 feels twice as intense as the pleasure of gaining $10,000. When portfolios drop 30-40%, the emotional pressure to “stop the bleeding” overwhelms rational analysis.
- Leverage liquidations: Retail traders tend to use higher leverage. During the February crash, positions at 10x-25x leverage were liquidated automatically, forcing sales at the worst possible prices.
- Information lag: By the time retail traders read headlines about a crash, the move has already happened. They sell into weakness, not before it.
- Social media amplification: Fear spreads faster than analysis. Twitter threads declaring “the bear market is here” trigger additional selling from traders who follow crowd sentiment rather than data.
Why Whales Buy at the Bottom
Whales — wallets holding 1,000+ BTC, institutional players, and long-term accumulators — operate on a completely different logic:
- They have longer time horizons. A whale accumulating at $65,000 is not trying to catch a bounce to $70,000. They are positioning for $100,000+ in the next cycle.
- They use data, not emotions. Whale buying decisions are driven by on-chain metrics, valuation models, and historical cycle analysis — not by headline sentiment.
- They have capital reserves. Whales do not invest 100% of their capital. They keep significant reserves specifically for moments like this — when fear creates mispriced assets.
- They understand market structure. Whales know that liquidation cascades push prices below fair value. They buy the artificial discount created by forced selling.
What the On-Chain Data Reveals Right Now
The current on-chain picture tells a compelling story. Let us examine the key signals that whales are watching — and acting on.
Whale Accumulation at Multi-Year Highs
Addresses holding between 10,000 and 100,000 BTC have accumulated more than 70,000 BTC since the start of February 2026, worth approximately $4.6 billion at current prices. Total whale holdings have risen to approximately 3.204 million BTC — the strongest accumulation pace in more than a year.
Glassnode’s Accumulation Trend Score climbed above 0.5 to 0.68, signaling that accumulation is spreading across nearly all wallet cohorts. This is not a single whale making a bet — it is a broad-based shift in positioning.
Exchange Outflows Accelerating
When whales buy, they move coins off exchanges and into cold storage. Since Bitcoin dropped below $80,000, the 30-day simple moving average of exchange whale outflows has climbed to 3.2%. This pattern — coins leaving exchanges during price declines — preceded the last bull market.
The logic is straightforward: coins on exchanges are available for selling. Coins in cold storage are not. Rising outflows reduce sell-side supply, creating a structural setup for price recovery.
Fear & Greed at Historic Extremes
The Fear & Greed Index printed 5 on February 6th and has hovered around 10 since. For context, during the FTX collapse in November 2022, the index bottomed at 12. During the Terra/Luna crash in May 2022, it reached 8. The current reading is more extreme than both.
Historically, sustained readings below 15 have coincided with major cycle bottoms or significant price reversals. This does not mean the bottom is confirmed — but it means fear has reached levels that have previously marked exhaustion points.
Supply in Profit vs. Loss Convergence
One of the most reliable cycle-bottom indicators is the convergence of BTC supply in profit versus supply in loss. Currently, approximately 11.1 million BTC sit in profit while 8.9 million BTC are in loss. When these two figures converge — meaning roughly half of all Bitcoin holders are underwater — bear markets have historically bottomed.
If convergence occurred at current cost basis levels, it would imply a spot price near $60,000, close to the flash crash low of $60,008 that was already tested on February 6th.
Net Realized Losses at 2022 Levels
Net realized losses hit $13.6 billion on February 7th — levels last seen during the deepest parts of the 2022 bear market. This indicates that a significant amount of capitulation has already occurred. Holders who were going to panic-sell have largely done so.
However, there is an important caveat: in 2022, the loss peak occurred five months before the actual bottom was printed. This means the current capitulation may be a mid-point rather than an endpoint.
How to Read Whale Signals — Without Being Fooled
Not all whale activity is bullish. Understanding context is critical.
Bullish Whale Signals
- Large exchange outflows during price declines: Whales buying and moving to cold storage during crashes. This is the strongest signal.
- Accumulation across multiple wallet cohorts: When small, medium, and large whales all accumulate simultaneously, the signal is more reliable than a single large buyer.
- Buying into extreme fear: Whale purchases when the Fear & Greed Index is below 20 have historically preceded recoveries.
- Increasing holdings despite negative headlines: When on-chain accumulation contradicts the prevailing narrative, the on-chain data is usually right.
Cautionary Whale Signals
- Whale accumulation during early bear markets: In the first half of 2022, whales accumulated aggressively — but the bottom did not arrive until November. Accumulation signals that you should pay attention, not that the bottom is in.
- Single-entity accumulation: One whale buying a large amount is less meaningful than broad-based accumulation across many wallets.
- Accumulation without volume recovery: If whales buy but overall market volume continues declining, the market may need more time to base.
The Key Principle
Whale accumulation is a necessary but not sufficient condition for a bottom. Every major bottom has been preceded by whale buying. But not every period of whale buying has immediately preceded a bottom. The signal tells you smart money sees value — but timing the exact bottom requires additional confirmation.
Using Smart Money Data in Your Trading Strategy
Understanding what whales are doing is valuable. But the real alpha comes from integrating this data into your own strategy. Here is how.
1. Track Whale Positioning as a Directional Bias
If whales are accumulating, your directional bias should lean long — even if short-term price action is bearish. This does not mean you should buy blindly. It means you should look for long setups rather than short setups, and give your long positions more room to work.
Conversely, when whales distribute (move coins to exchanges, reduce holdings), your bias should shift toward caution, tighter stops, and smaller position sizes.
2. Combine Whale Data with Technical Signals
Whale accumulation alone is not an entry signal. Combine it with technical confirmation:
- Whale accumulation + RSI divergence: If whales are buying and RSI shows bullish divergence on the daily chart, the probability of a reversal increases significantly.
- Whale accumulation + volume spike at support: A volume spike at a key support level combined with on-chain accumulation suggests that level is likely to hold.
- Whale accumulation + MACD crossover: When MACD confirms a bullish crossover while whales are accumulating, it aligns momentum with positioning.
With TraderSpy, you can set compound alerts that combine these technical conditions across all major pairs — BTCUSDT, ETHUSDT, SOLUSDT, and more. When RSI divergence appears alongside a volume spike, you get a real-time notification so you can evaluate the setup immediately.
3. Monitor Top Trader Positions in Real Time
On-chain whale tracking shows aggregate behavior. But what about individual top traders — the ones with consistently profitable track records?
TraderSpy’s Smart Money feature tracks top trader positions across Binance, Bybit, and Hyperliquid with 2-second updates. You can see:
- Which direction top traders are positioned (long or short)
- Their entry prices, leverage, and unrealized PnL
- When they add to positions, reduce exposure, or close entirely
- How multiple top traders are positioned on the same pair
When 7 out of 10 top traders on Binance are long on BTCUSDT with low leverage, and on-chain data shows whale accumulation at the same time — that convergence is far more powerful than either signal alone.
4. Use Fear & Greed as a Position Sizing Guide
The Fear & Greed Index should influence your position sizing, not your direction. Here is a practical framework:
- Extreme Fear (0-20): Maximum position size for long entries. This is when risk-reward is best. Use conservative leverage (2-3x maximum).
- Fear (20-40): Standard position size for longs. Good entries available but not at capitulation levels.
- Neutral (40-60): Reduce position size. Wait for directional clarity before committing.
- Greed (60-80): Minimum position size. Tighten stops. Consider taking partial profits.
- Extreme Greed (80-100): Defensive mode. Reduce exposure. Prepare for potential reversal.
TraderSpy’s Market Insight dashboard displays the Fear & Greed Index alongside derivatives data, hot coin rankings, and a market heatmap — giving you the complete sentiment picture in one view.
5. Watch Funding Rates for Leverage Extremes
Funding rates reveal how leveraged the market is — and in which direction. In early 2026, Bitcoin funding rates reached +0.51%, signaling extreme long-side leverage. This created the conditions for the February liquidation cascade.
When funding rates reach extremes in either direction, the market is primed for a violent move in the opposite direction. Use this as a risk signal:
- Extremely positive funding: The market is overleveraged long. Be cautious with new long positions. Consider reducing exposure.
- Extremely negative funding: The market is overleveraged short. Short squeeze potential is high. Look for long entries with tight risk.
- Near-zero funding: The market is balanced. Follow technical signals without leverage-related bias.
TraderSpy tracks funding rates and derivatives data across all supported exchanges, making it easy to spot these extremes before they trigger a cascade.
Building a Whale-Informed Trading System
Here is a practical system that integrates whale and smart money data with technical analysis:
Step 1: Check the Macro Picture
Before any trade, review:
- Fear & Greed Index (available on TraderSpy’s Market Insight dashboard)
- Derivatives data and funding rates
- Hot coin rankings to identify where capital is flowing
Step 2: Identify the Smart Money Direction
- Follow 5-10 top traders on TraderSpy’s Smart Money dashboard
- Note their directional bias (majority long or short)
- Check their leverage levels (low leverage = higher conviction)
Step 3: Find Technical Entry Points
Use TraderSpy’s compound alerts to identify setups that align with smart money direction:
- RSI oversold/overbought combined with MACD crossover
- Volume spikes at key support/resistance levels
- Bollinger Band squeezes indicating imminent volatility
Step 4: Size Your Position Based on Sentiment
Use the Fear & Greed Index to calibrate your position size. Maximum size during extreme fear for longs. Minimum size during extreme greed.
Step 5: Set Risk Parameters
Every trade needs:
- A stop loss placed above liquidation price with slippage buffer
- A take profit target based on support/resistance or risk-to-reward ratio
- Isolated margin mode to protect the rest of your account
Step 6: Monitor and Adjust
After entering, continue monitoring smart money positioning. If top traders start closing longs, tighten your stop or reduce your position size. If they add to longs, hold your position with confidence.
The Historical Pattern: What Happened After Past Whale Accumulation Phases
History does not repeat, but it rhymes. Here is what followed previous periods of extreme whale accumulation:
March 2020 (COVID Crash)
Bitcoin crashed to $3,800. Whales accumulated aggressively. Within 12 months, Bitcoin reached $60,000 — a 15x return from the bottom.
June 2022 (Post-Terra/Luna)
Whale accumulation increased after Bitcoin fell below $20,000. The bottom came in November 2022 at $15,500. From there, Bitcoin rallied to $126,000 by October 2025 — an 8x return.
February 2026 (Current)
Whales have accumulated over 70,000 BTC since the start of the month. Bitcoin is trading near $65,000-70,000 after a 40-50% drawdown from the $126,000 all-time high. The pattern is eerily similar to previous accumulation phases that preceded major recoveries.
The critical difference: past accumulation phases lasted weeks to months before a sustained recovery began. Patience is required.
What This Means for Your Next Move
The data is clear: smart money is accumulating Bitcoin at levels that have historically preceded significant recoveries. The Fear & Greed Index is at record lows. Whale accumulation is at multi-year highs. Exchange outflows are accelerating. Net realized losses have reached capitulation levels.
None of this guarantees an immediate bottom. But it does tell you three things:
- The risk-reward for long positions is improving. When whales buy and retail panics, the eventual resolution has historically favored the whales.
- This is not the time to panic-sell. If smart money with billions in capital sees value at these levels, selling into their bids is historically the wrong move.
- Preparation matters more than prediction. You do not need to pick the exact bottom. You need a system that alerts you to high-probability setups, tracks what the best traders are doing, and manages your risk automatically.
TraderSpy gives you that system. Smart Money tracking shows you what top traders are doing in real time. Compound alerts notify you when technical conditions align with smart money positioning. The Market Insight dashboard puts sentiment, derivatives data, and market structure in one view. And auto-trading with built-in risk controls ensures your strategy executes consistently — even when emotions are running high.
The whales are buying. The question is whether you will have the tools and the discipline to position alongside them — or whether you will join the 335,000 traders who were on the wrong side of the trade.
Getting Started
- Open the Smart Money dashboard on TraderSpy and follow 5-10 top traders with consistent track records.
- Set compound alerts for RSI divergence + volume spike on BTCUSDT and ETHUSDT.
- Check the Fear & Greed Index daily on the Market Insight dashboard.
- Size your positions according to the sentiment framework above.
- Use isolated margin and set stop losses on every position.
- Be patient. Whale accumulation phases can last weeks. The opportunity does not disappear overnight.
Smart money is making its move. Now it is your turn.