Market Analytics Guide: Volatility, Trend, and Volume
A practical guide to crypto futures market analytics covering volatility, trend analysis, volume behavior, and how to use market data for smarter trades.
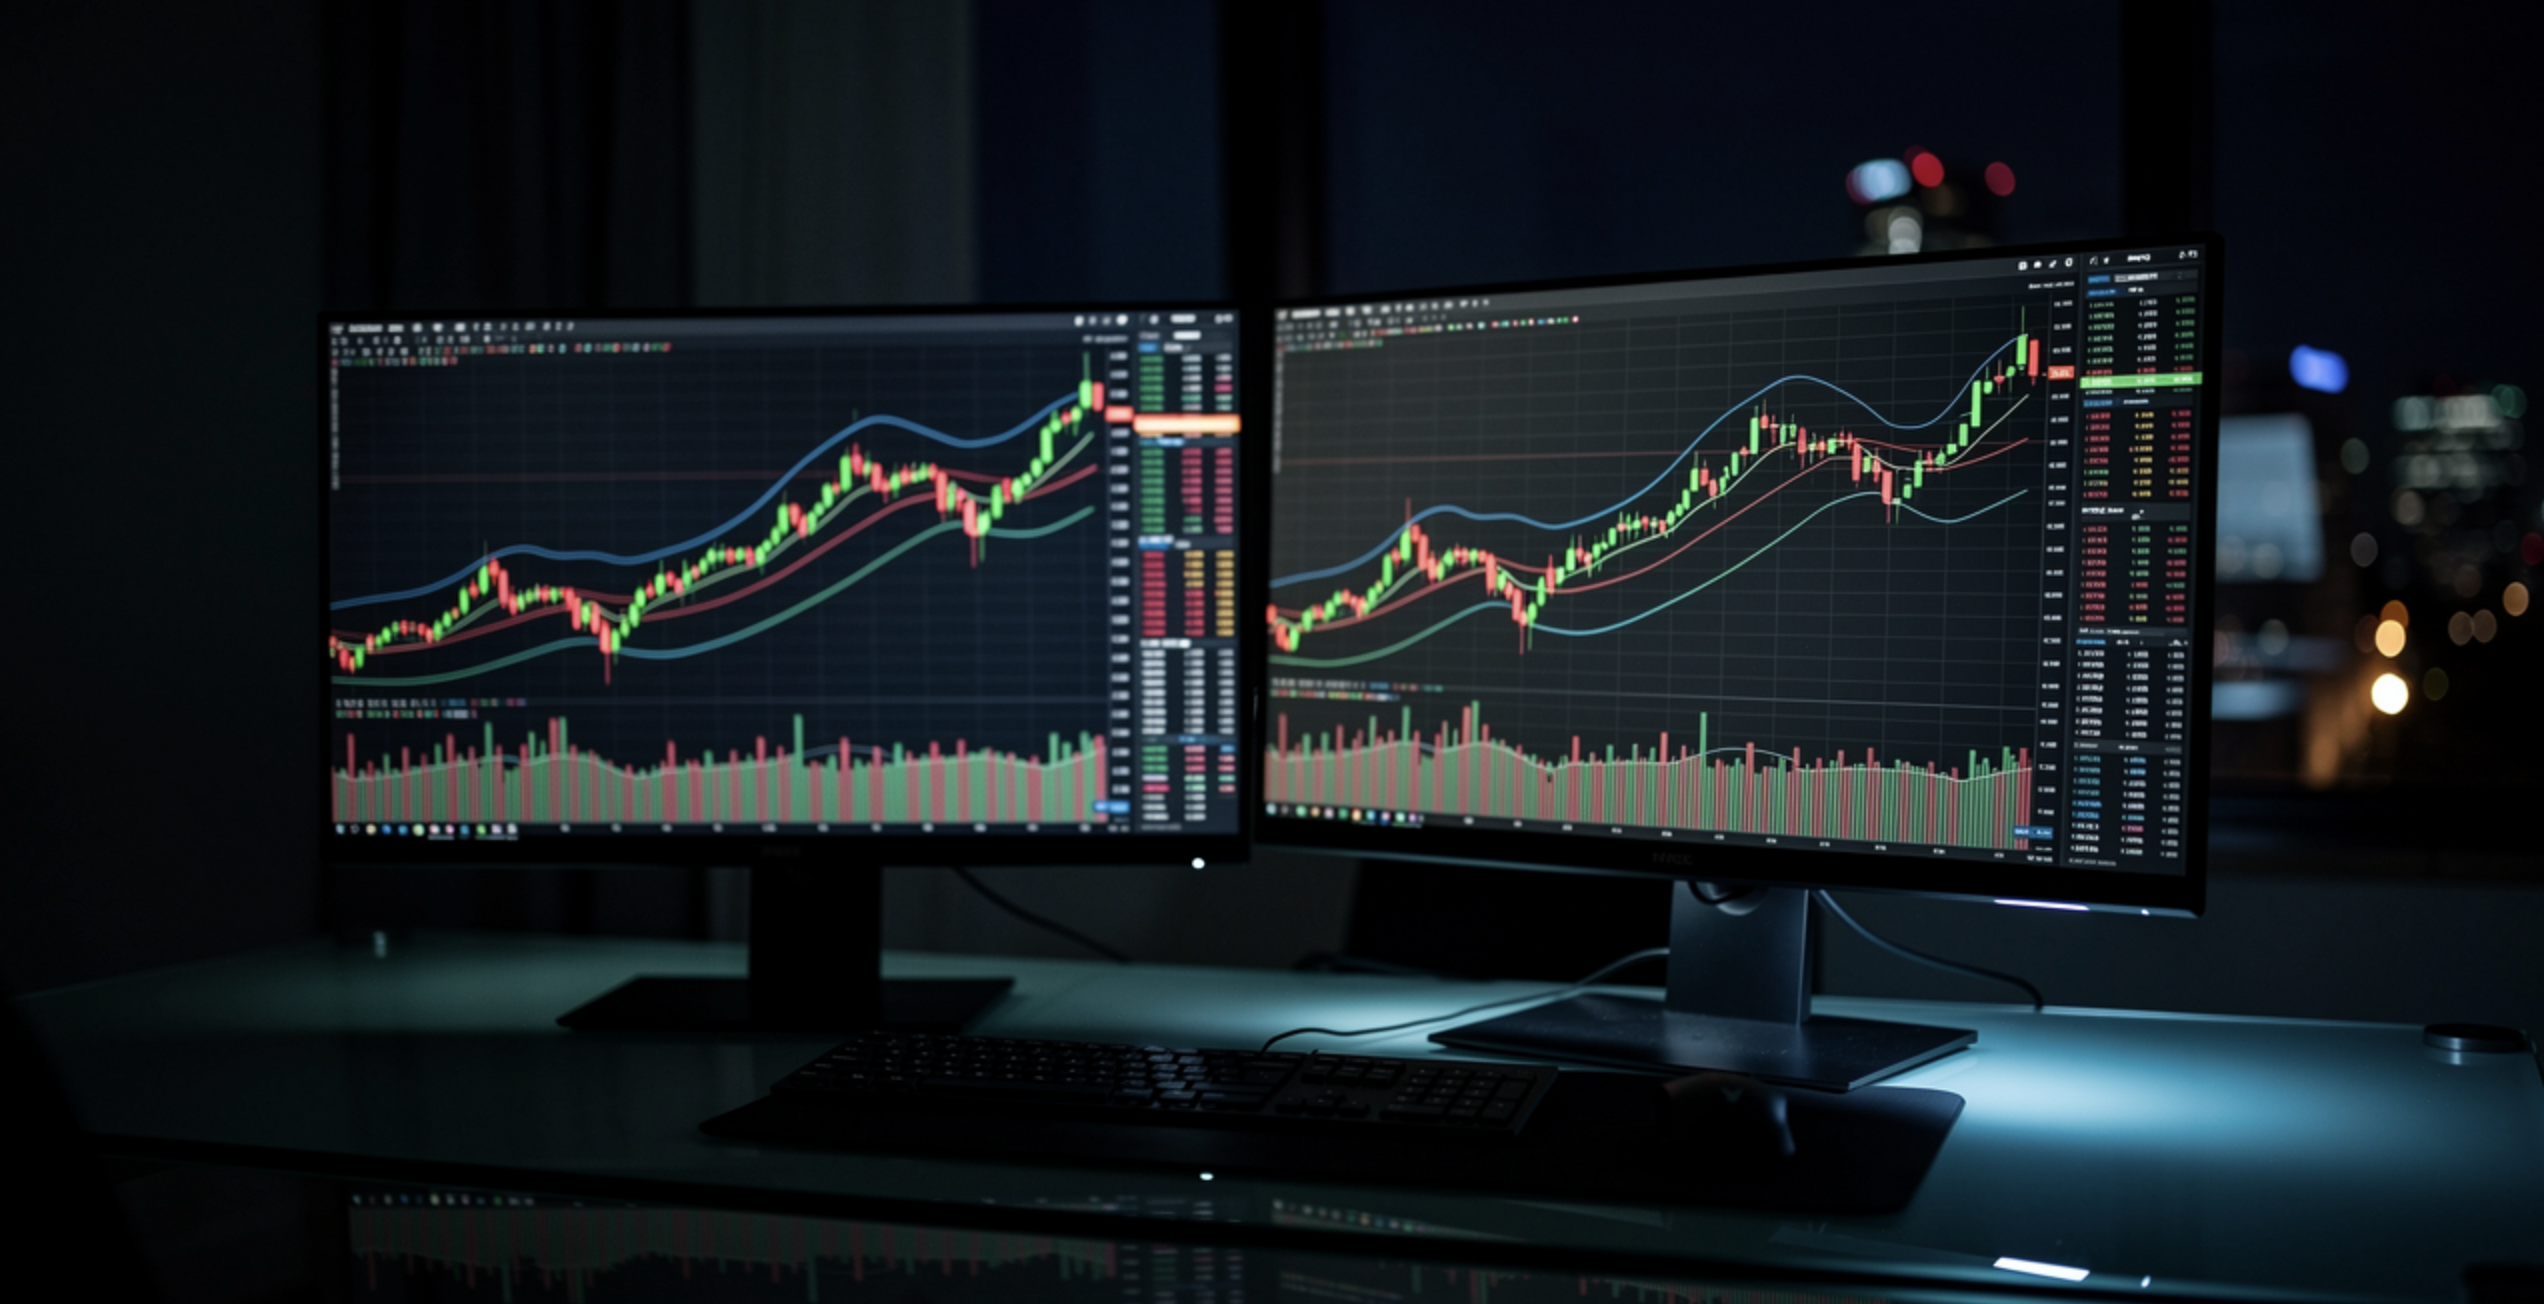
Trading without understanding market conditions is like driving blindfolded. Market analytics gives you the visibility you need — showing you whether the market is trending or ranging, volatile or calm, and whether participants are buying or selling with conviction.
Understanding Volatility
Volatility measures how much price moves within a given period. In crypto futures, volatility is your opportunity and your risk.
- High volatility means larger price swings. This creates bigger profit potential but also demands wider stop losses and smaller position sizes. Breakout strategies tend to perform well in volatile conditions.
- Low volatility means tighter ranges. Prices consolidate, and breakouts are less reliable. Mean-reversion strategies and range trading work better here.
TraderSpy’s Bollinger Bands indicator helps you visualize volatility in real time. When the bands squeeze, a breakout is likely approaching. When they expand, a move is already underway.
Reading the Trend
Trend analysis answers the most fundamental question in trading: which direction is price moving?
- Uptrend: Higher highs and higher lows. Price stays above key moving averages (EMA 20, SMA 50).
- Downtrend: Lower highs and lower lows. Price stays below key moving averages.
- Sideways: No clear direction. Price oscillates between support and resistance levels.
The ADX indicator (Average Directional Index) quantifies trend strength on a 0–100 scale. A reading above 25 suggests a strong trend. Below 20 signals a weak or absent trend. Knowing this prevents you from applying trend-following strategies in ranging markets.
Volume Tells the Story
Volume is the fuel behind price movements. A price breakout on high volume is far more reliable than one on low volume. Here is what to watch:
- Rising price + rising volume = Strong bullish conviction. The trend is likely to continue.
- Rising price + falling volume = Weak rally. A reversal may be approaching.
- Volume spikes at key levels (support, resistance, round numbers) often signal significant market decisions.
TraderSpy tracks volume across all supported pairs and compares current volume against the 20-period moving average, making it easy to spot anomalies.
The Bigger Picture
Beyond individual indicators, TraderSpy’s Market Insight dashboard provides a comprehensive overview including the Fear & Greed Index, derivatives data, hot coins, and a market heatmap. These tools give you context — helping you understand whether the broader market favors risk-on or risk-off behavior before you commit to a trade.
Practical Takeaway
Before every trade, ask three questions: Is the market volatile or calm? Is there a clear trend? Does volume confirm the move? If you can answer these, you are already ahead of most traders.