Geopolitical Risk and Crypto Futures: A Trader's Playbook
Learn how geopolitical crises drive crypto futures volatility and discover proven strategies to trade Bitcoin and altcoins during wartime uncertainty.
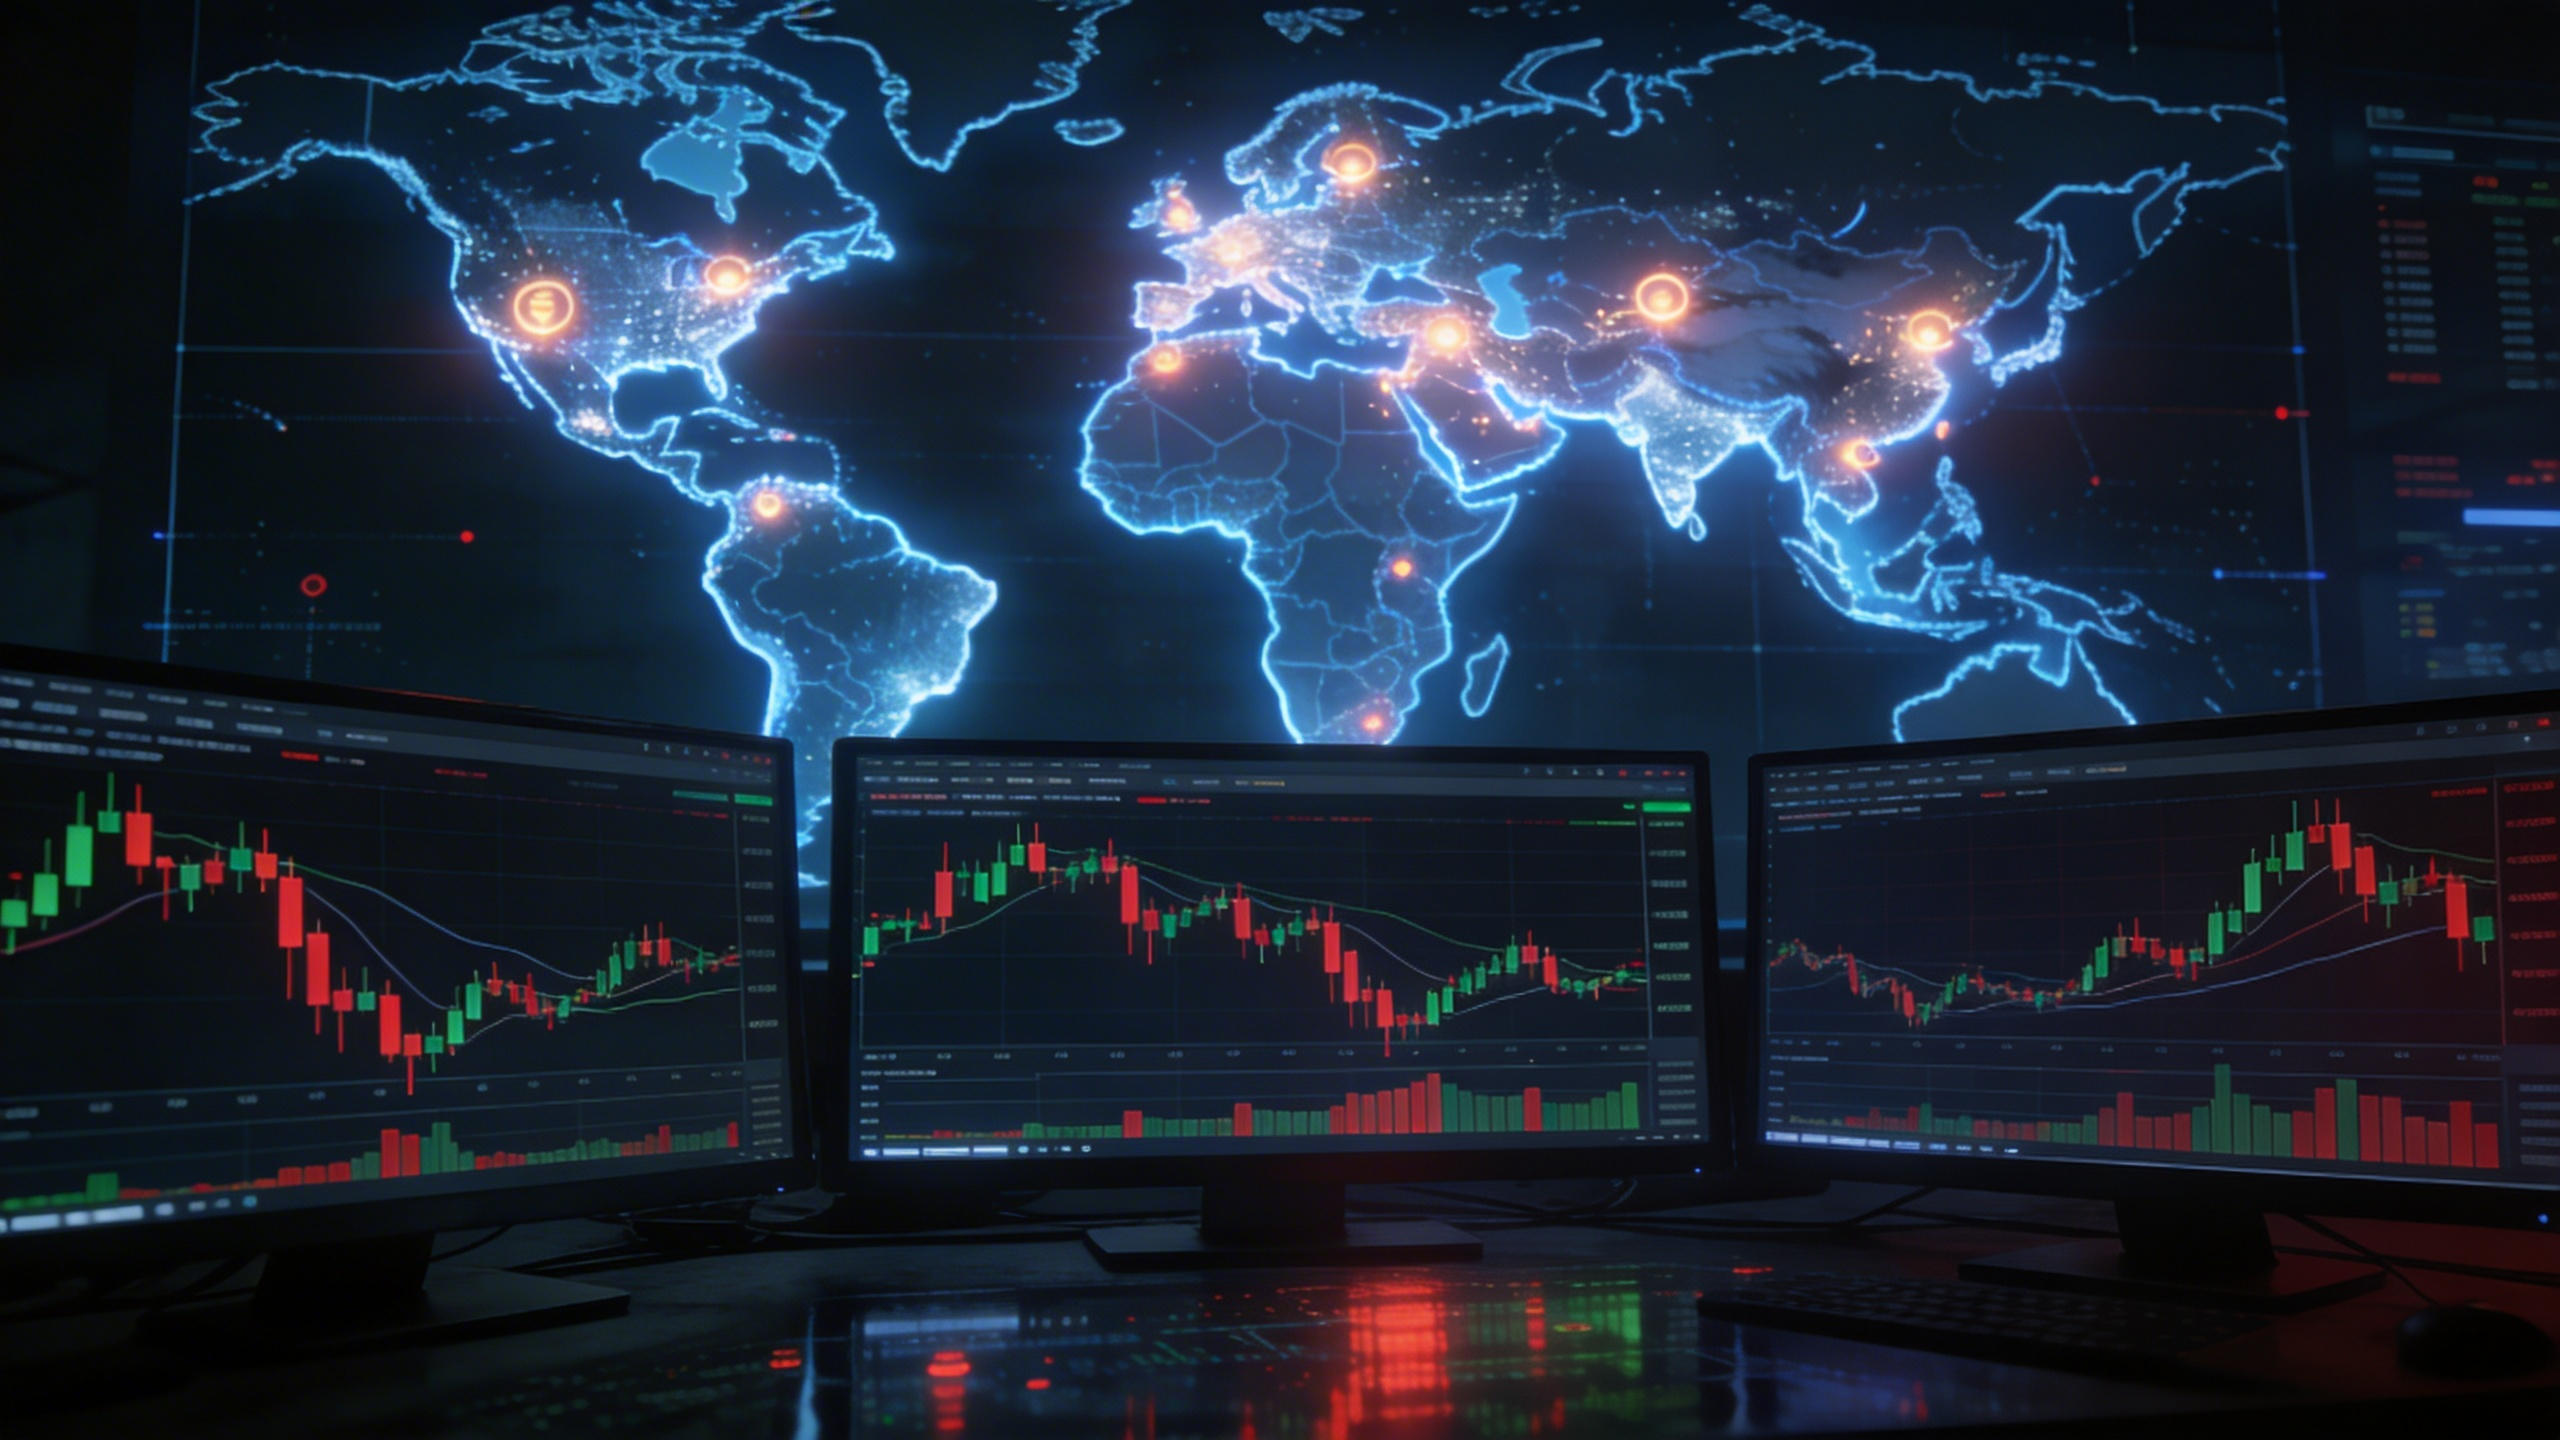
Geopolitical crises have become one of the most powerful drivers of crypto futures volatility in 2026. With Bitcoin testing the $67,000 level amid the ongoing US-Iran conflict and the Fear and Greed Index plunging to single digits, futures traders face a market where headlines move prices faster than any technical indicator. Understanding how geopolitical risk translates into trading opportunities is no longer optional. It is a core survival skill for crypto futures participants.
Why Geopolitical Events Hit Crypto Futures Hardest
Unlike spot markets, futures markets amplify every geopolitical tremor through leverage. When the US-Israeli strikes on Iran began on February 28, BTCUSDT futures saw more than $400 million in liquidations within 48 hours, with the vast majority hitting long positions. The cascading effect of forced liquidations pushed Bitcoin briefly below $63,000 before a sharp recovery.
This amplification happens because futures traders carry margin positions that become vulnerable during sudden volatility spikes. A 4% spot move can trigger a 40% loss on a 10x leveraged position, and these margin calls create a feedback loop of forced selling that drives prices well beyond what fundamentals justify.
The crypto futures market has also become a geopolitical barometer. When President Trump announced a five-day suspension of strikes on Iranian energy infrastructure via a social media post on March 23, BTCUSDT surged from $68,000 to over $71,000 in under four hours. That single post generated more price movement than weeks of on-chain data.
The Three Phases of Geopolitical Crypto Volatility
Every major geopolitical event follows a recognizable pattern in crypto futures markets, and understanding these phases gives you a structural edge.
Phase 1: The Shock Drop (0-48 hours). Panic selling dominates. Liquidation cascades clear out overleveraged longs. Funding rates flip deeply negative. This is where the most capital is destroyed and where amateur traders panic sell at the worst possible prices.
Phase 2: The Digestion Period (2-14 days). Markets stabilize as traders process the new reality. Volatility remains elevated but becomes more two-directional. Open interest rebuilds gradually. This is where skilled traders begin accumulating positions at favorable levels.
Phase 3: The Repricing (2-8 weeks). Markets establish a new equilibrium that prices in the geopolitical reality. Bitcoin has historically shown resilience in this phase. Since the Iran conflict escalated, BTC has actually risen roughly 7%, outperforming the S&P 500, Nasdaq, gold, and silver.
Key Indicators to Watch During Geopolitical Crises
Standard technical analysis still works during geopolitical events, but you need to weight certain indicators more heavily and add non-traditional signals to your toolkit.
Oil Prices as a Leading Indicator
During the current conflict, oil prices have proven to be the single best predictor of crypto direction. When Brent crude pushes above $100 per barrel, it sustains the inflation narrative and removes any prospect of rate cuts, which is structurally bearish for BTCUSDT and ETHUSDT. When oil falls back toward $80-85, the inflation pressure eases and the rate-cut thesis revives, providing a tailwind for crypto.
Funding Rates and Sentiment Divergence
Negative funding rates during a geopolitical crisis are one of the strongest contrarian signals available to futures traders. Since early March, Bitcoin funding rates have remained negative even as price held above $67,000. This disconnect between bearish positioning and price resilience suggests that sellers are becoming exhausted. Historically, extended periods of negative funding combined with stable prices have preceded sharp rallies.
Fear and Greed Index Extremes
The Fear and Greed Index has spent 46 consecutive days in extreme fear territory as of late March. Data from Glassnode shows that purchases made when this index drops below 15 have delivered a median 90-day return of +38.4% on Bitcoin. When the index hit 8, it signaled one of the deepest pessimism readings since the post-FTX collapse.
RSI and Bollinger Band Compression
During geopolitical uncertainty, watch for RSI divergence on the 4-hour and daily charts. When price makes lower lows but RSI forms higher lows, it signals weakening sell pressure even as headlines remain negative. Combine this with Bollinger Band squeeze patterns on BTCUSDT and ETHUSDT. Tight Bollinger Bands during a crisis indicate that a significant directional move is building, and the geopolitical phase model above can help you anticipate which direction.
Risk Management Rules for Crisis Trading
Trading futures during geopolitical events requires stricter risk management than normal market conditions. Here are the rules that separate survivors from casualties.
Reduce position sizes by 50-75%. Standard position sizing assumes normal volatility. During geopolitical crises, intraday swings of 5-8% become common. Cutting your size protects your capital while still allowing participation.
Widen your stop losses using ATR. The Average True Range expands dramatically during crisis periods. A stop loss that works in a normal market will get triggered by noise in a volatile one. Use 2x ATR instead of your standard 1x for stop placement, and accept the wider risk by reducing position size proportionally.
Avoid the first 24-48 hours. The initial panic phase produces the worst risk-reward setups. Spreads widen, liquidity thins, and emotional trading dominates. The best entries almost always come during Phase 2, after the initial shock has been absorbed.
Monitor liquidation heatmaps. Large clusters of liquidation levels above and below current price act as magnets during volatile periods. Knowing where these clusters sit helps you avoid placing stops in the most dangerous zones.
How TraderSpy Gives You the Edge
Navigating geopolitical volatility requires real-time data and automated alert systems that work faster than you can manually monitor charts. TraderSpy is built specifically for this kind of environment.
With 40+ AI-powered alert presets, you can set compound conditions that combine RSI, MACD, Bollinger Bands, Volume, and EMA into a single alert. For example, a crisis recovery preset might trigger when RSI crosses above 30 on the 4-hour chart while MACD histogram turns positive and volume exceeds the 20-period average. These multi-indicator alerts filter out the noise that dominates crisis markets.
The Smart Money tracking feature monitors top traders across Binance, Bybit, and Hyperliquid with 2-second update intervals. During geopolitical shocks, watching what institutional and elite traders are doing is far more valuable than reading headlines. If smart money is accumulating while retail is panic selling, that divergence is one of the highest-conviction signals available.
The Market Insight dashboard puts the Fear and Greed Index, derivatives data, hot coins, and market heatmap in a single view. During fast-moving geopolitical events, having all sentiment data consolidated saves critical decision-making time. You can spot the shift from Phase 1 panic to Phase 2 digestion in real time.
For traders who want to act on crisis signals automatically, Auto Trading connects directly to Binance Futures with encrypted API keys. You can define entry conditions based on technical indicators and let the system execute when your criteria are met, removing the emotional hesitation that causes most traders to miss the best crisis entries.
Building Your Geopolitical Trading Framework
The traders who profit from geopolitical volatility are the ones who prepare before the crisis hits. Here is a practical framework you can implement today.
- Create a crisis watchlist with BTCUSDT, ETHUSDT, SOLUSDT, and XRPUSDT on multiple timeframes (15m, 1h, 4h, daily)
- Set compound alerts in TraderSpy for RSI oversold + Bollinger Band lower breach + volume spike on your watchlist pairs
- Monitor funding rates daily and flag any divergence between negative funding and stable or rising prices
- Track oil prices as your macro leading indicator for crypto direction
- Pre-define position sizes at 25-50% of your normal size for crisis entries
- Use ATR-based stops at 2x the 14-period ATR to avoid noise-driven stop-outs
The Key Takeaway
Geopolitical crises are not random disruptions to your trading plan. They are recurring market events with recognizable patterns that create some of the best risk-reward opportunities in crypto futures. The current environment, with the Fear and Greed Index at historic lows, negative funding rates, and Bitcoin outperforming traditional assets despite an active military conflict, contains exactly the kind of setup that has historically preceded significant recoveries.
The difference between traders who get destroyed by geopolitical volatility and those who profit from it comes down to preparation, discipline, and having the right tools. Build your framework now, set your alerts on TraderSpy, and be ready to act when the market gives the signal.