Crypto Funding Rates Explained: The Hidden Signal That Predicted the February Crash
Learn how crypto funding rates work, why extreme rates predicted the February 2026 liquidation cascade, and how to use funding data as a trading edge in perpetual futures.
In late January 2026, Bitcoin perpetual futures funding rates hit +0.51% — one of the highest readings in two years. Most traders ignored it. Within days, $2.2 billion in leveraged positions were liquidated, Bitcoin crashed from $76,000 to $60,008, and over 335,000 traders lost everything.
The funding rate had been screaming a warning. The market was dangerously overleveraged on the long side, and every experienced derivatives trader knew what was coming. Yet the majority of retail traders had no idea what a funding rate even was — let alone how to use it as a trading signal.
Funding rates are one of the most underused and misunderstood indicators in crypto trading. They tell you exactly how leveraged the market is, which direction the crowd is betting, and when a violent reversal is most likely. This guide explains how funding rates work, what they reveal about market structure, and how to turn them into a practical trading edge.
What Are Funding Rates?
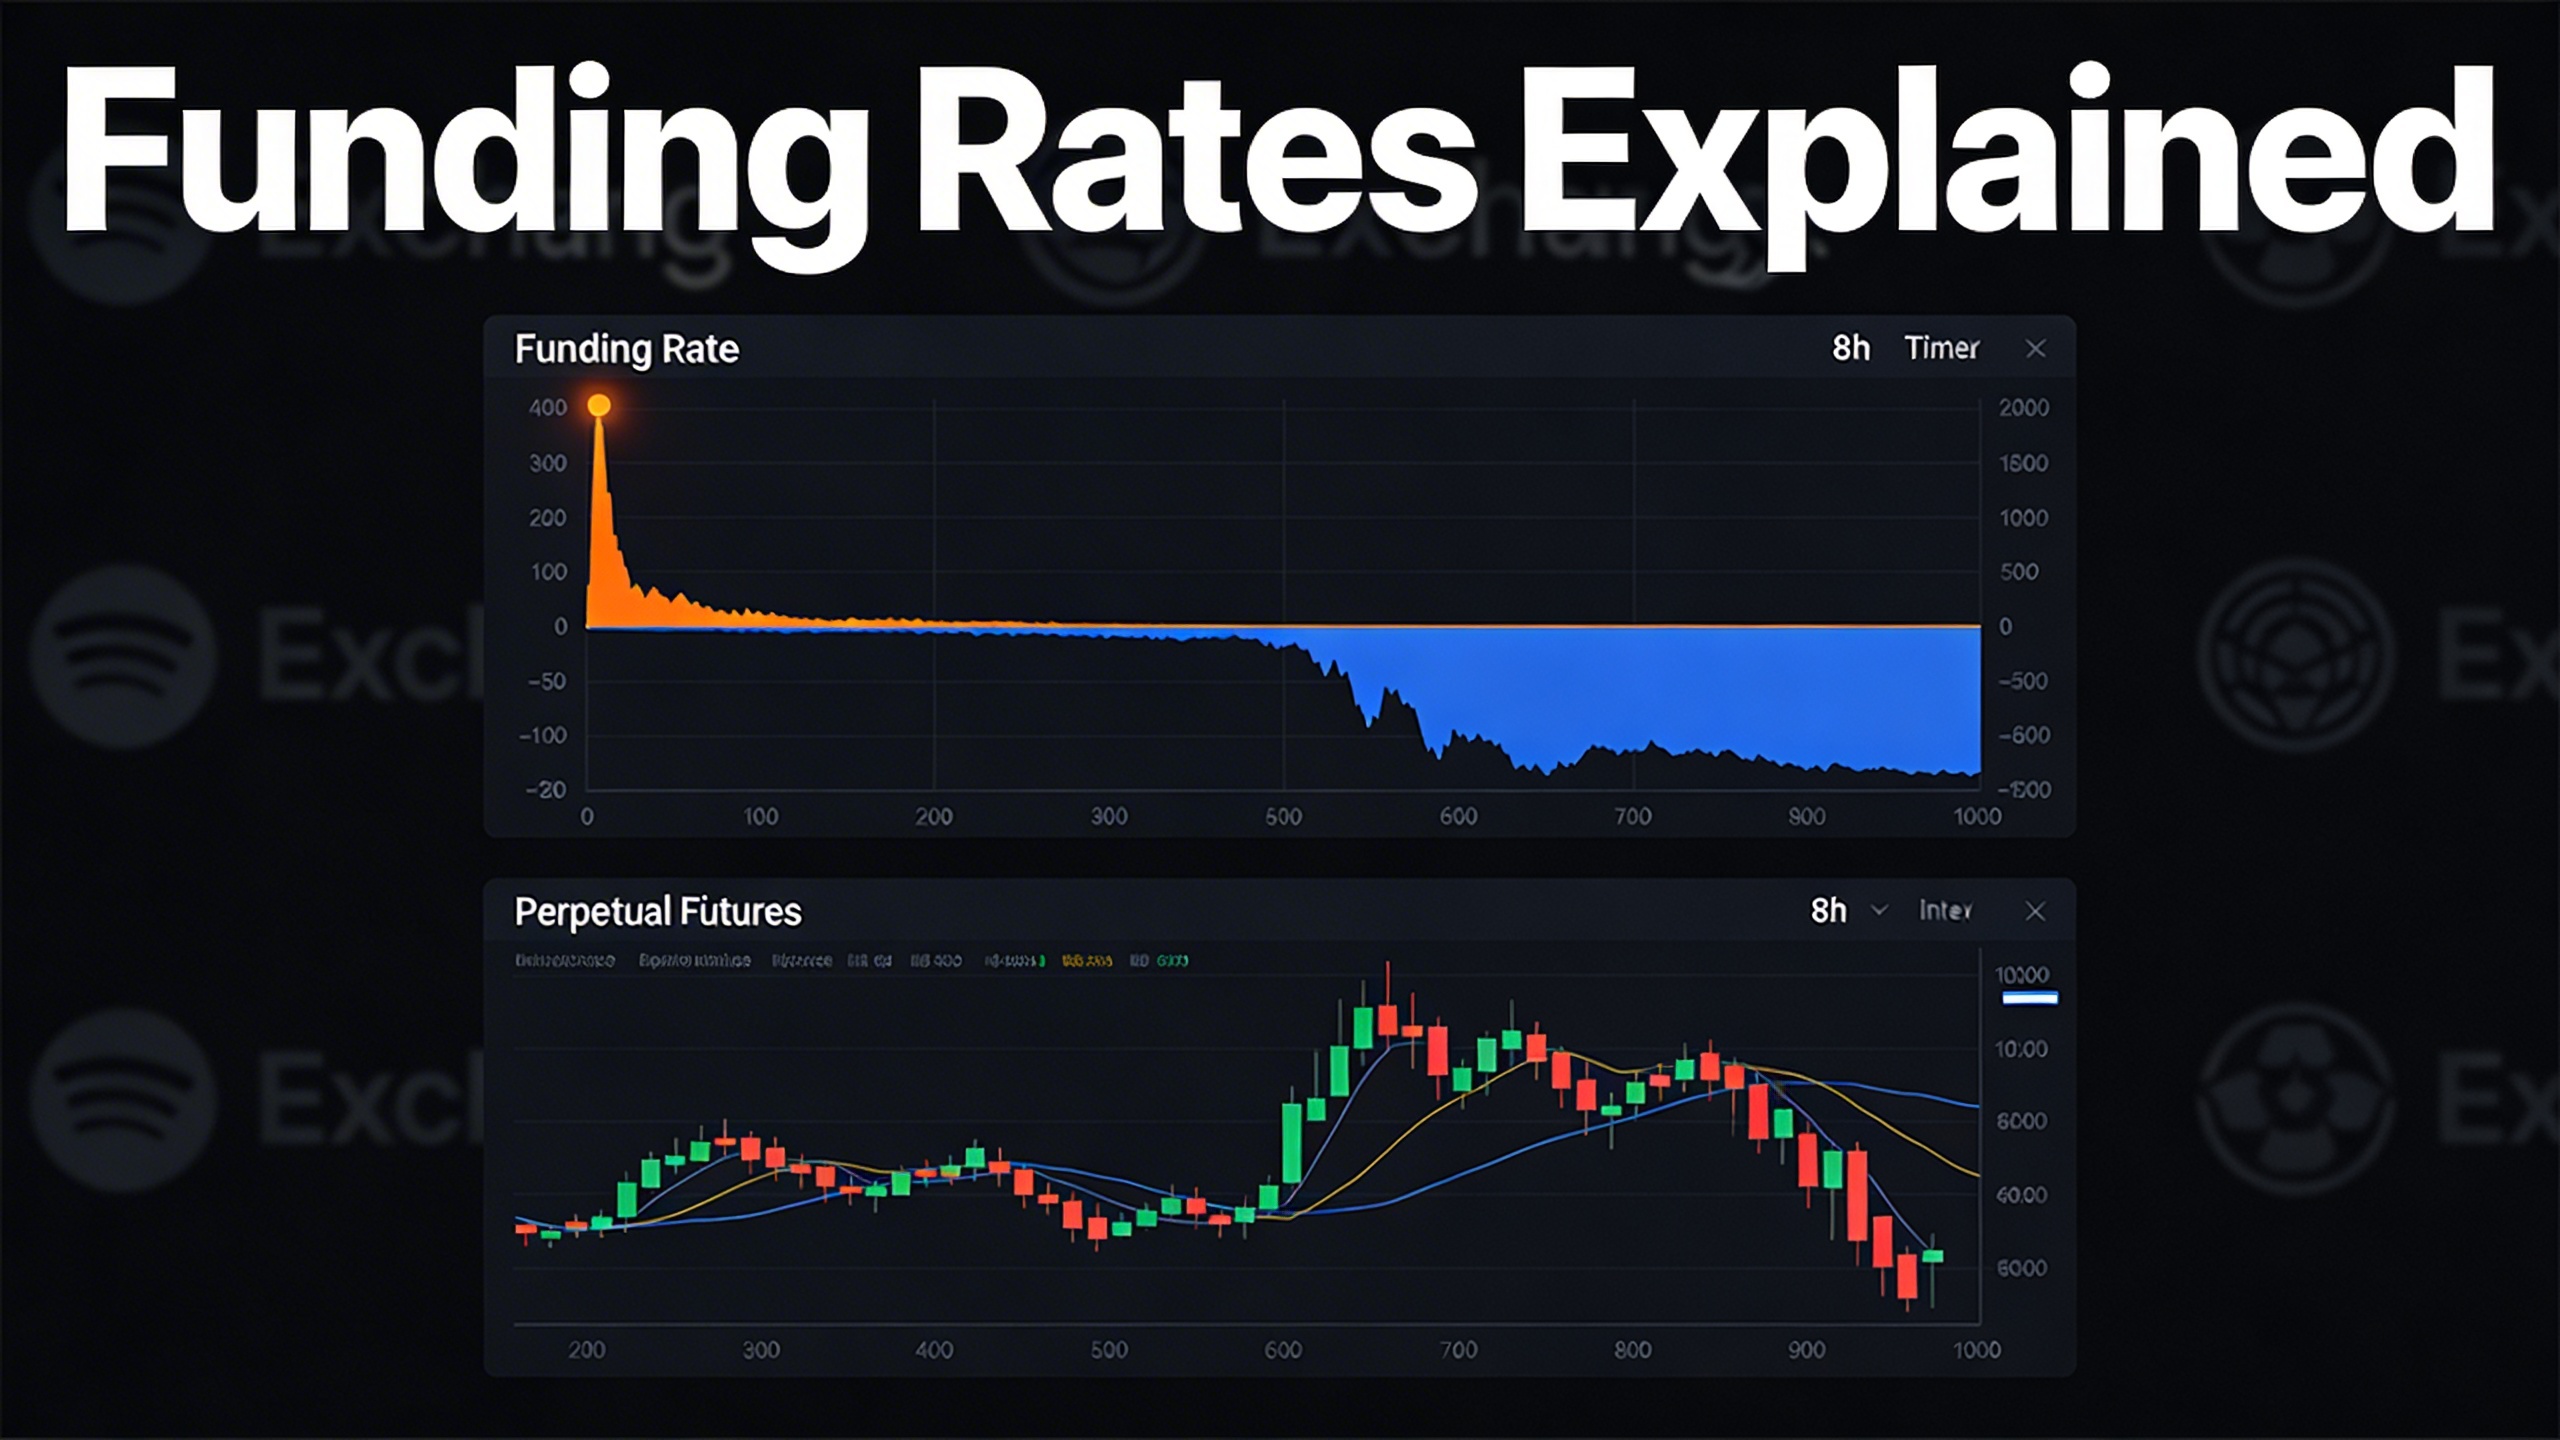
Perpetual futures contracts — the most traded instrument in crypto — have no expiration date. Unlike traditional futures that settle on a specific date, perpetual contracts (or “perps”) can be held indefinitely. This creates a problem: without expiration, the perpetual price can drift away from the actual spot price.
Funding rates solve this. They are periodic payments exchanged between long and short traders, designed to keep the perpetual futures price anchored to spot.
Here is the core mechanic:
- When the perp price is above spot (more people are long): Long traders pay short traders. The positive funding rate incentivizes closing longs and opening shorts, which pushes the perp price back toward spot.
- When the perp price is below spot (more people are short): Short traders pay long traders. The negative funding rate incentivizes closing shorts and opening longs, pulling the perp price back up.
On most exchanges, funding payments occur every 8 hours — three times per day. Binance uses a base rate of 0.01% per interval (0.03% per day), but the actual rate fluctuates based on market conditions and can go significantly higher or lower.
Why Funding Rates Matter More Than You Think
Most traders look at funding rates only as a cost of holding a position. If you are long and the funding rate is +0.02%, you pay 0.02% of your position value every 8 hours. That adds up — 0.06% per day, 1.8% per month. On a $100,000 position, that is $1,800 per month just to stay in the trade.
But the real value of funding rates is not as a cost calculator. It is as a sentiment and positioning indicator — one of the most reliable in crypto.
What Funding Rates Tell You
Extreme positive funding (above +0.05% per interval): The market is crowded long. Everyone is bullish. Leverage is piled on one side. This is the setup that precedes liquidation cascades — because all those long positions have liquidation prices below the current market. A modest price drop can trigger the first wave of liquidations, which triggers the next, and so on.
In January 2026, Bitcoin funding rates reached +0.51% — meaning long traders were paying short traders a massive premium to maintain their positions. This extreme imbalance was a textbook warning of what was about to happen.
Extreme negative funding (below -0.03% per interval): The market is crowded short. Fear is dominant. Everyone expects further downside. This creates the conditions for a short squeeze — a violent upward move that liquidates short positions and forces rapid buying.
After the February 6th crash, Bitcoin funding rates briefly went negative for the first time in months. Traders who recognized this as a contrarian signal positioned for the V-shaped recovery that followed.
Near-zero funding (between -0.01% and +0.01%): The market is balanced. Neither longs nor shorts dominate. This is the most neutral state — where technical signals carry the most weight because there is no leverage-driven bias distorting price action.
The Predictive Power of Extreme Rates
Here is why extreme funding rates are so valuable: they reveal leverage concentration before it unwinds.
When funding is extremely positive, it means an unusually large number of traders are long with leverage. Each of those positions has a liquidation price. If enough of them are clustered at similar levels, even a small price move can start a cascade.
The February 2026 crash was a textbook example. Funding rates above +0.05% had persisted for weeks. Long open interest was at record highs. The market needed only a catalyst — the Federal Reserve chairman nomination — to trigger the unwind. The extreme funding rate did not cause the crash, but it told you the market was primed for one.
Similarly, in past cycles:
- May 2021: Funding rates hit extreme positive levels before Bitcoin crashed from $64,000 to $30,000.
- November 2022: Funding went deeply negative during the FTX collapse, marking the capitulation that preceded the bottom.
- March 2024: Extreme positive funding before the correction from $73,000 to $56,000.
The pattern is consistent: extreme funding rates precede major moves in the opposite direction.
How to Read Funding Rate Data
Raw funding rate numbers need context. Here is a practical framework for interpreting them.
The Funding Rate Spectrum
| Funding Rate (per 8h) | Signal | Market State |
|---|---|---|
| Above +0.10% | Danger zone | Extremely overleveraged long. Reversal risk is very high. |
| +0.05% to +0.10% | Caution | Heavily long-biased. Tighten stops, reduce position size. |
| +0.01% to +0.05% | Normal bullish | Longs dominate but within historical range. Trend following works. |
| -0.01% to +0.01% | Neutral | Balanced market. Follow technical signals. |
| -0.03% to -0.01% | Normal bearish | Shorts dominate but within range. Caution on longs. |
| -0.05% to -0.03% | Opportunity zone | Heavily short-biased. Short squeeze potential rising. |
| Below -0.05% | Contrarian buy zone | Extreme fear and short leverage. Historically near bottoms. |
Funding Rate + Open Interest
Funding rate alone tells you direction. Combined with open interest (the total value of outstanding futures contracts), it tells you magnitude.
- Rising funding + rising open interest: New money is entering long positions. The trend has fuel but leverage is building. Monitor closely.
- Rising funding + falling open interest: Existing shorts are being squeezed. The move may be running out of momentum.
- Falling funding + rising open interest: New short positions are being opened. Bearish pressure is building with conviction.
- Falling funding + falling open interest: Longs are being liquidated or closed. The deleveraging process is underway.
The most dangerous combination is extreme positive funding + high open interest — which is exactly what existed in late January 2026.
Cross-Exchange Divergence
Funding rates are not identical across exchanges. Binance, Bybit, and Hyperliquid can show different rates for the same pair at the same time. When rates diverge significantly, it reveals where leverage is concentrated.
If Binance shows +0.08% funding on BTCUSDT while Bybit shows +0.02%, the long-side leverage is concentrated on Binance. A cascade is more likely to originate there.
TraderSpy tracks derivatives data across all major exchanges, making it easy to compare funding rates and spot these divergences in real time.
Funding Rate Trading Strategies
Understanding funding rates opens up several practical strategies — from directional trading to market-neutral income generation.
Strategy 1: Contrarian Positioning on Extreme Rates
This is the simplest and most powerful application. When funding rates reach extremes, position for the reversal:
- Extreme positive funding: Look for short entries or reduce long exposure. Wait for technical confirmation (RSI overbought, MACD bearish crossover, volume divergence) before entering.
- Extreme negative funding: Look for long entries or reduce short exposure. Wait for technical confirmation (RSI oversold, MACD bullish crossover, support holding with volume).
The key is patience. Extreme funding can persist for days or even weeks before the reversal happens. Use stop losses to manage risk while waiting.
With TraderSpy, you can set compound alerts that trigger when funding rates reach extreme levels AND technical indicators confirm a reversal setup. For example: “Alert me when BTCUSDT funding exceeds +0.05% AND RSI drops below 70 on the 1h chart.” This ensures you act on confirmed setups rather than timing the exact top.
Strategy 2: Funding Rate Arbitrage
When funding is consistently positive, long traders pay shorts. You can capture this payment while remaining market-neutral:
- Go short on perpetual futures (to receive funding payments)
- Go long on spot (to hedge price risk)
Your spot long cancels out your perp short in terms of price exposure. But you collect the funding payment every 8 hours. At +0.05% per interval, that is 0.15% per day — or approximately 54% annualized.
The risks:
- Execution risk: Both positions must be opened simultaneously to avoid directional exposure.
- Funding rate changes: The rate can drop to zero or go negative, eliminating or reversing your edge.
- Margin requirements: The short perp position requires margin and can be liquidated in extreme moves.
This is an institutional-grade strategy, but retail traders with adequate capital can execute it on exchanges like Binance.
Strategy 3: Funding as a Position Sizing Filter
Even if you do not trade funding rates directly, use them to adjust your position sizing:
- High positive funding: Reduce long position sizes by 50%. The market is overleveraged and your risk of being caught in a cascade is elevated.
- High negative funding: Increase long position sizes (within your risk limits). The market is overleveraged short, and the risk-reward for longs is improving.
- Neutral funding: Use your standard position sizing based on technical analysis.
This simple adjustment would have saved billions in the February crash. Traders who reduced long exposure when funding was at +0.51% preserved their capital while those who maintained full positions were liquidated.
Strategy 4: Funding Rate + Smart Money Convergence
The most powerful signals occur when funding rate data aligns with smart money positioning:
- Extreme positive funding + top traders reducing longs: This is a double warning. Both the leverage structure and the smart money are signaling danger. Reduce exposure immediately.
- Extreme negative funding + top traders opening longs: This is a high-conviction contrarian buy signal. The crowd is short, the smart money is accumulating, and the market is primed for a squeeze.
TraderSpy’s Smart Money feature tracks top trader positions across Binance, Bybit, and Hyperliquid with 2-second updates. Combining this with derivatives data from the Market Insight dashboard gives you both the leverage picture and the institutional positioning in one view.
The February 2026 Case Study: Funding Rates in Action
Let us trace exactly how funding rates predicted and amplified the February crash, step by step.
Phase 1: The Buildup (January 10-28)
Bitcoin was trading between $85,000 and $95,000. Optimism was high. Funding rates steadily climbed from +0.02% to +0.05%, then to +0.10%, and eventually reached +0.51%. Open interest hit all-time highs. The market was loading up on long leverage.
What the funding rate said: The market is dangerously overleveraged long. Any catalyst will trigger a cascade.
Phase 2: The Catalyst (January 29 - February 1)
The Federal Reserve chairman nomination triggered a risk-off rotation. Bitcoin started dropping. As it broke below $85,000, the first wave of liquidations hit.
What the funding rate showed: Funding spiked even higher briefly as longs scrambled to maintain positions, then collapsed as liquidations accelerated.
Phase 3: The Cascade (February 1-6)
$2.2 billion in liquidations. Bitcoin crashed through $76,000, then $70,000, all the way to $60,008. Funding rates plummeted, eventually going negative for the first time in months.
What the funding rate showed: The transition from extreme positive to negative was the deleveraging process in real time. All the excess long leverage was being flushed from the system.
Phase 4: The Recovery (February 6-10)
With funding rates negative and leverage reset, the conditions for a bounce were set. Bitcoin staged a V-shaped recovery from $60,008 back above $70,000.
What the funding rate showed: Negative funding meant shorts were now paying longs. This incentivized closing shorts and opening longs — the exact dynamic that powers a recovery.
Traders who understood this cycle — buildup, catalyst, cascade, recovery — had multiple opportunities to protect capital and even profit from the move.
Building a Funding Rate Dashboard
Here is how to integrate funding rate analysis into your daily trading routine.
Daily Checklist
- Check funding rates on TraderSpy’s Market Insight dashboard for BTC, ETH, and your traded pairs
- Compare across exchanges to identify where leverage is concentrated
- Assess open interest alongside funding — rising OI with extreme funding is the danger signal
- Review smart money positioning on the Smart Money dashboard
- Adjust position sizing based on the funding rate spectrum above
Alert Setup
Configure compound alerts on TraderSpy for:
- Funding rate extreme + RSI divergence: Early warning of a reversal setup
- Funding rate extreme + volume spike: Potential cascade or squeeze beginning
- Funding rate flip (positive to negative or vice versa): Major shift in market structure
The platform evaluates conditions every 5-10 seconds across BTCUSDT, ETHUSDT, SOLUSDT, and 20+ other pairs, ensuring you catch these signals the moment they appear.
What to Do When Funding Hits Extremes
When funding exceeds +0.05%:
- Tighten stop losses on all long positions
- Reduce position sizes by at least 50%
- Do not open new long positions without strong technical confirmation
- Consider hedging with a small short position
- Monitor smart money for signs of distribution
When funding drops below -0.05%:
- Start scaling into long positions at key support levels
- Set wider stops to account for volatility
- Look for RSI oversold + MACD bullish crossover confirmation
- Follow smart money — if top traders are opening longs, increase conviction
- Be patient — bottoms are processes, not events
Common Mistakes with Funding Rates
Mistake 1: Trading Funding Alone
Extreme funding is a warning, not an entry signal. The market can remain irrational longer than you can remain solvent. Always combine funding data with technical analysis and smart money positioning before entering a trade.
Mistake 2: Ignoring Funding Costs
If you hold a long position during sustained positive funding, the costs compound. At +0.05% per 8 hours, you lose 0.15% per day — 4.5% per month. On a leveraged position, this erodes your margin and brings your liquidation price closer. Factor funding costs into your trade thesis.
Mistake 3: Assuming Funding Equals Direction
Positive funding does not mean the price will go up. It means longs are paying shorts. The price can continue rising despite high funding — it just means the risk of a reversal is elevated. Use funding as a risk gauge, not a directional predictor.
Mistake 4: Ignoring Cross-Exchange Differences
A +0.02% funding rate on Binance and a -0.01% rate on Bybit for the same pair tells you leverage is skewed differently across venues. Cascades often start where leverage is most concentrated.
The Funding Rate Edge
Funding rates are the heartbeat of the crypto derivatives market. They reveal what no price chart can show: the invisible leverage structure beneath the surface. The February 2026 crash proved — again — that ignoring this data is expensive.
The traders who survived were watching funding rates weeks before the crash. They saw the buildup. They reduced exposure. They waited for the reset. And when funding went negative and the market bottomed, they were positioned to buy — while everyone else was liquidated.
TraderSpy puts this data at your fingertips. The Market Insight dashboard displays funding rates, derivatives data, and market sentiment alongside your technical alerts. The Smart Money feature shows how top traders are responding to the same data. And compound alerts ensure you never miss the moment when funding rates signal danger — or opportunity.
The next time funding rates hit extreme levels, you will not be wondering what it means. You will be acting on it.
Getting Started
- Open the Market Insight dashboard on TraderSpy and review current funding rates across BTC, ETH, and SOL.
- Set a compound alert for funding rate extreme + RSI divergence on your most-traded pairs.
- Check the funding rate spectrum table above before every trade to calibrate your position size.
- Follow top traders on the Smart Money dashboard and observe how their positioning changes when funding hits extremes.
- Track funding costs on your open positions — if they exceed 0.05% per interval, reassess whether the trade is worth holding.
The data is there. The patterns repeat. The only question is whether you will use them.