Bitcoin ETF Outflows: What Futures Traders Must Know
Bitcoin ETFs lost $3.8B in five weeks. Learn how ETF outflows impact crypto futures, trigger liquidation cascades, and what smart money does.
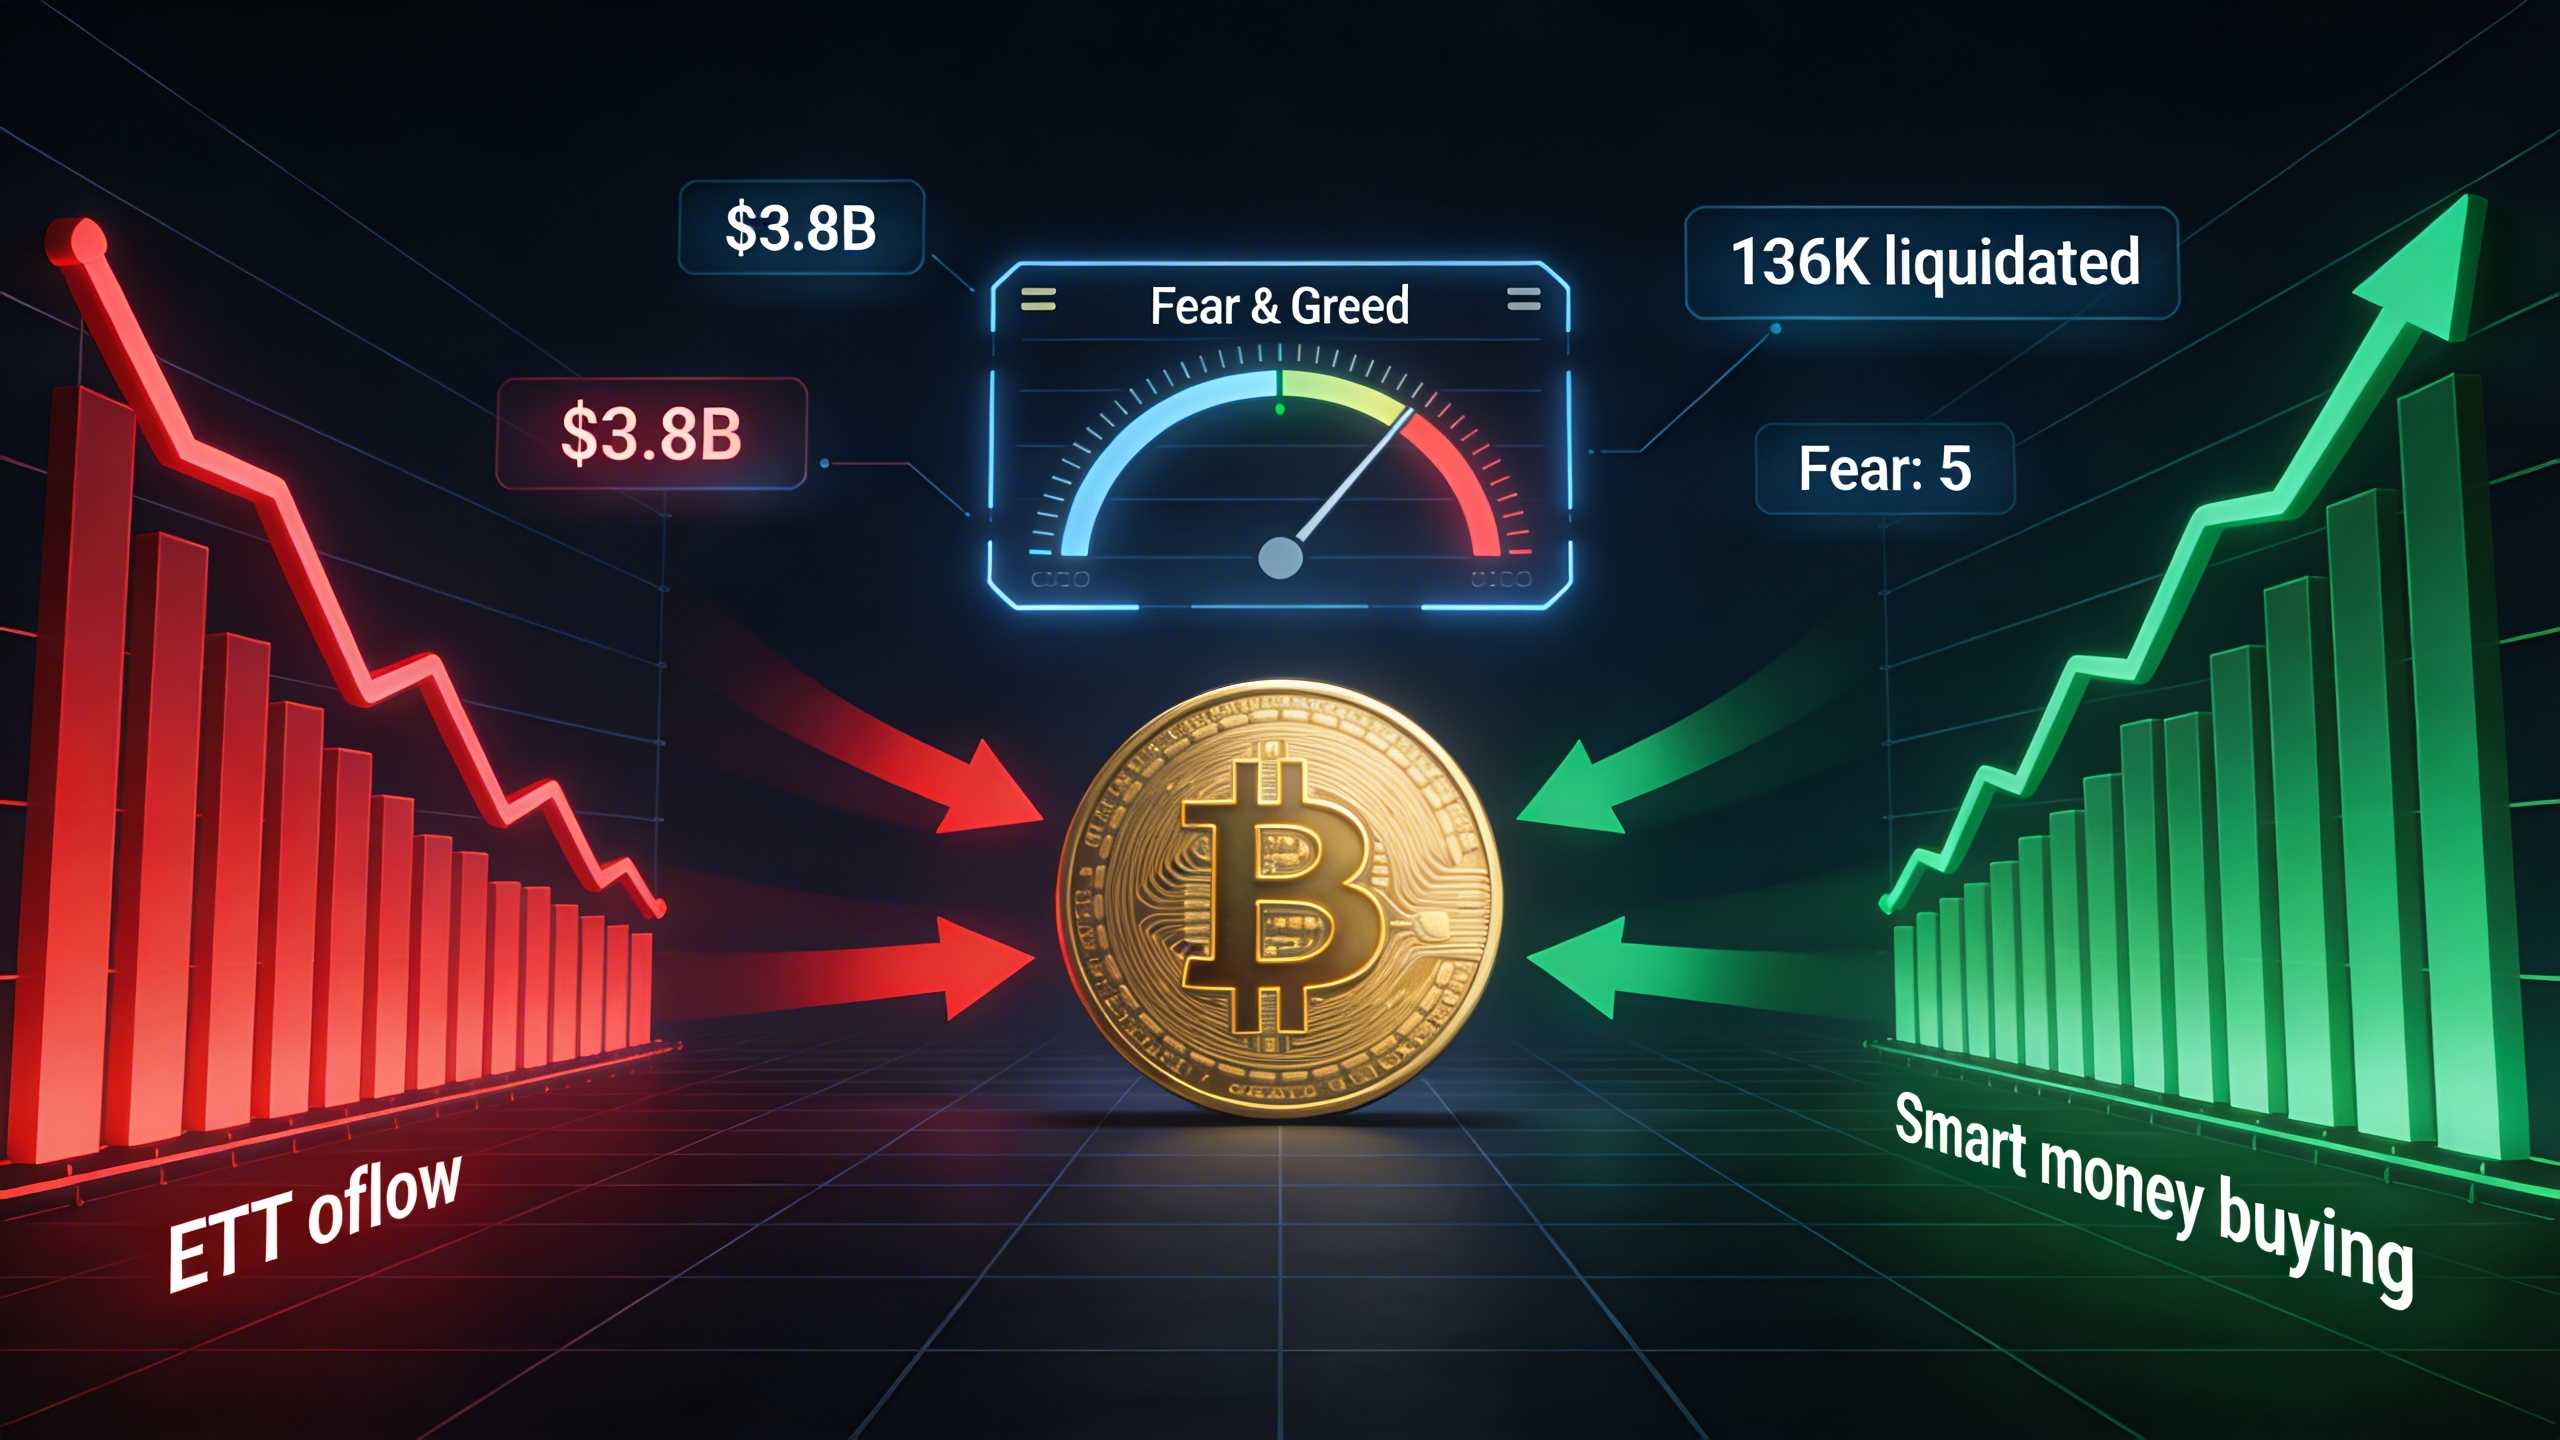
Bitcoin spot ETFs have bled $3.8 billion in five consecutive weeks. BlackRock’s IBIT alone lost $2.1 billion. Fidelity’s FBTC shed over $954 million. The Fear and Greed Index sits at 5 — a level not seen since 2019. And on February 23, over $458 million in futures positions were liquidated in a single day, with 92% of those being longs.
If you trade crypto futures and you are not watching ETF flows, you are trading blind. Here is why ETF outflows matter, how they trigger liquidation cascades, and what the smart money divergence tells you about where the market is heading next.
Why ETF Flows Move Crypto Futures
When a spot Bitcoin ETF sees net redemptions, the fund manager must sell actual Bitcoin to meet those withdrawals. This is not a derivative or a synthetic exposure — it is direct selling pressure on the underlying asset.
The scale matters. At peak, U.S. spot Bitcoin ETFs held over $60 billion in assets. When $3.8 billion flows out in five weeks, that is sustained, relentless sell pressure that hits spot markets first and futures markets immediately after.
Here is the chain reaction:
- ETF redemptions force fund managers to sell BTC on spot exchanges
- Spot price drops push perpetual futures funding rates negative
- Leveraged long positions hit liquidation thresholds
- Forced liquidations create more sell pressure, driving price lower
- More liquidations trigger — the cascade feeds itself
This is exactly what happened on February 23. Trump’s 15% tariff announcement was the match. Five weeks of ETF outflows and excessive derivatives leverage was the gasoline. The result: $458 million liquidated, 136,000 traders wiped out, and Bitcoin falling below $64,000.
The Numbers Behind the February Crash
Understanding the mechanics requires looking at the data:
ETF Outflow Timeline:
- Week 1 (Jan 20-24): -$620M net outflows
- Week 2 (Jan 27-31): -$870M net outflows
- Week 3 (Feb 3-7): -$740M net outflows
- Week 4 (Feb 10-14): -$680M net outflows
- Week 5 (Feb 17-21): -$890M net outflows
Each week of selling added more pressure to an already fragile market. Spot volume dropped 59% week-over-week heading into the crash. The derivatives market was carrying record open interest relative to volume — a classic setup for cascading liquidations.
Liquidation Breakdown (Feb 23):
- Total liquidations: $458M in 24 hours
- Long liquidations: $430M (92% of total)
- Largest single liquidation: $61.5M on HTX BTC-USDT
- Traders liquidated: 136,000+
- Bitcoin contribution: $232M
- Ethereum contribution: $126M
The February 1 crash had already produced $2.2 billion in liquidations across 335,000 traders. February has seen $3-4 billion in total liquidations in a single week at its worst.
The Smart Money Divergence
Here is where it gets interesting. While retail traders were getting liquidated and ETFs were bleeding capital, on-chain data tells a completely different story for large holders.
Whales have increased their total Bitcoin holdings by roughly 230,000 BTC over the past three months — valued at approximately $15.59 billion at current prices. This is the highest whale accumulation rate since the 2022 bottom, when Bitcoin was trading at $16,000 before rallying to its all-time high of $126,198.
The pattern is not new, but it is reliable: when retail panics and leverage gets flushed, smart money accumulates. The question is whether you can see this divergence in real time — or only in hindsight.
How to Track ETF Flows as a Futures Trader
ETF flow data is publicly available but scattered across multiple sources. Most traders check it once a day, if at all. By the time you read about $890 million in weekly outflows, the market has already moved.
What you need is a system that connects the dots between macro signals and your trading execution. Here is the practical framework:
Step 1: Monitor the Sentiment Shift
The Fear and Greed Index is your first warning system. When it drops below 20, the market is pricing in panic. When it hits single digits — like the current 5 — you are in historically extreme territory where reversals often begin.
TraderSpy’s Market Insight dashboard displays the Fear and Greed Index alongside derivatives data, hot coin rankings, and a market heatmap. You do not need to check five different websites. The sentiment context is right next to your alert system.
Step 2: Watch What Top Traders Do, Not What They Say
During the February 23 crash, crypto Twitter was full of panic. “Bitcoin to $45K.” “The bull market is over.” “Sell everything.” Meanwhile, top futures traders on Binance were quietly opening long positions at $64,000-65,000 with low leverage — a high-conviction accumulation signal.
This is the data most traders never see. TraderSpy’s Smart Money dashboard tracks the actual futures positions of top traders on Binance, Bybit, and Hyperliquid with 2-second updates. You see their direction, leverage, entry price, unrealized PnL, and position changes in real time. When 7 out of 10 top traders are going long during a fear event, that tells you something no ETF flow chart can.
Step 3: Set Compound Alerts for the Reversal
Single-indicator alerts are useless during a crash. RSI will show “oversold” for days while price keeps falling. What you need is a compound condition — multiple indicators aligning simultaneously to signal that the selling pressure is actually exhausting.
TraderSpy lets you combine RSI + MACD + Bollinger Bands + Volume + EMA in a single alert, evaluated every 5-10 seconds across 100+ pairs. When oversold RSI coincides with a MACD bullish crossover and a volume spike on the 4-hour chart — and the Smart Money dashboard confirms top traders are accumulating — that is a setup with real confluence.
Step 4: Use the Fear as Your Edge
The data consistently shows that extreme fear readings correlate with significant rallies in the following 30-90 days. A Fear and Greed score of 5 does not mean buy blindly — but it does mean the market has already priced in most of the bad news.
When you combine extreme fear + whale accumulation + smart money long positioning + compound technical signals, you have a framework that has historically identified major bottoms. Not every time — no system is perfect — but the probability skews heavily in your favor.
What Most Traders Get Wrong During ETF Outflow Periods
The biggest mistake is treating ETF outflows as a reason to sell. By the time the outflow data is published, the selling has already happened. The price already reflects it.
The second mistake is ignoring the leverage buildup that precedes a crash. Open interest relative to volume is the canary in the coal mine. When too many traders are positioned the same way with too much leverage, any catalyst — tariffs, a Fed comment, a geopolitical escalation — will trigger the cascade.
The third mistake is not watching what smart money does during the fear. Retail sells. Whales buy. Top futures traders accumulate. This happens every single time. The only question is whether you have the tools to see it in real time.
Building Your Crash Trading Playbook
Here is a practical approach for navigating ETF-driven selloffs:
-
Before the crash: Monitor Fear and Greed weekly. When it drops below 25, reduce leverage and tighten stops. Check ETF flow data for sustained outflow trends.
-
During the crash: Do not panic sell. Open the Smart Money dashboard on TraderSpy and watch what top traders are doing. If they are accumulating, the bottom is likely forming.
-
At the bottom: Wait for compound alert confirmation — RSI oversold + MACD crossover + volume spike. Do not try to catch the exact bottom. Enter with low leverage (2-3x) and scale in.
-
After the bounce: Monitor funding rates. When they flip from negative to positive, the market is transitioning from fear to greed. This is where the strongest rallies begin.
The Key Takeaway
ETF outflows are not just institutional noise — they are the single most important macro signal for crypto futures traders in 2026. They create direct selling pressure, trigger liquidation cascades, and generate the extreme fear conditions where smart money accumulates.
The traders who profit from these events are not the ones with the best predictions. They are the ones with the best information flow: real-time sentiment data, smart money positioning, and compound technical alerts that identify reversals before the crowd.
TraderSpy puts all of this in one platform — Fear and Greed Index, derivatives data, Smart Money tracking with 2-second updates, and 40+ AI-powered compound alerts. Start with the free tier and see what the smart money is doing right now, while the Fear and Greed Index sits at 5 and most traders are paralyzed by fear.
The best trades happen when everyone else is afraid to trade.